Dashboard
All of your Workforce data will roll up into a Dashboard that will highlight key elements and insights into the efficiency and productivity of your labor force. Some key insights include visibility into any upcoming assignments with no designated employee, any upcoming jobs that have not yet been staffed, and which employees are available to be utilized based on the selected date range.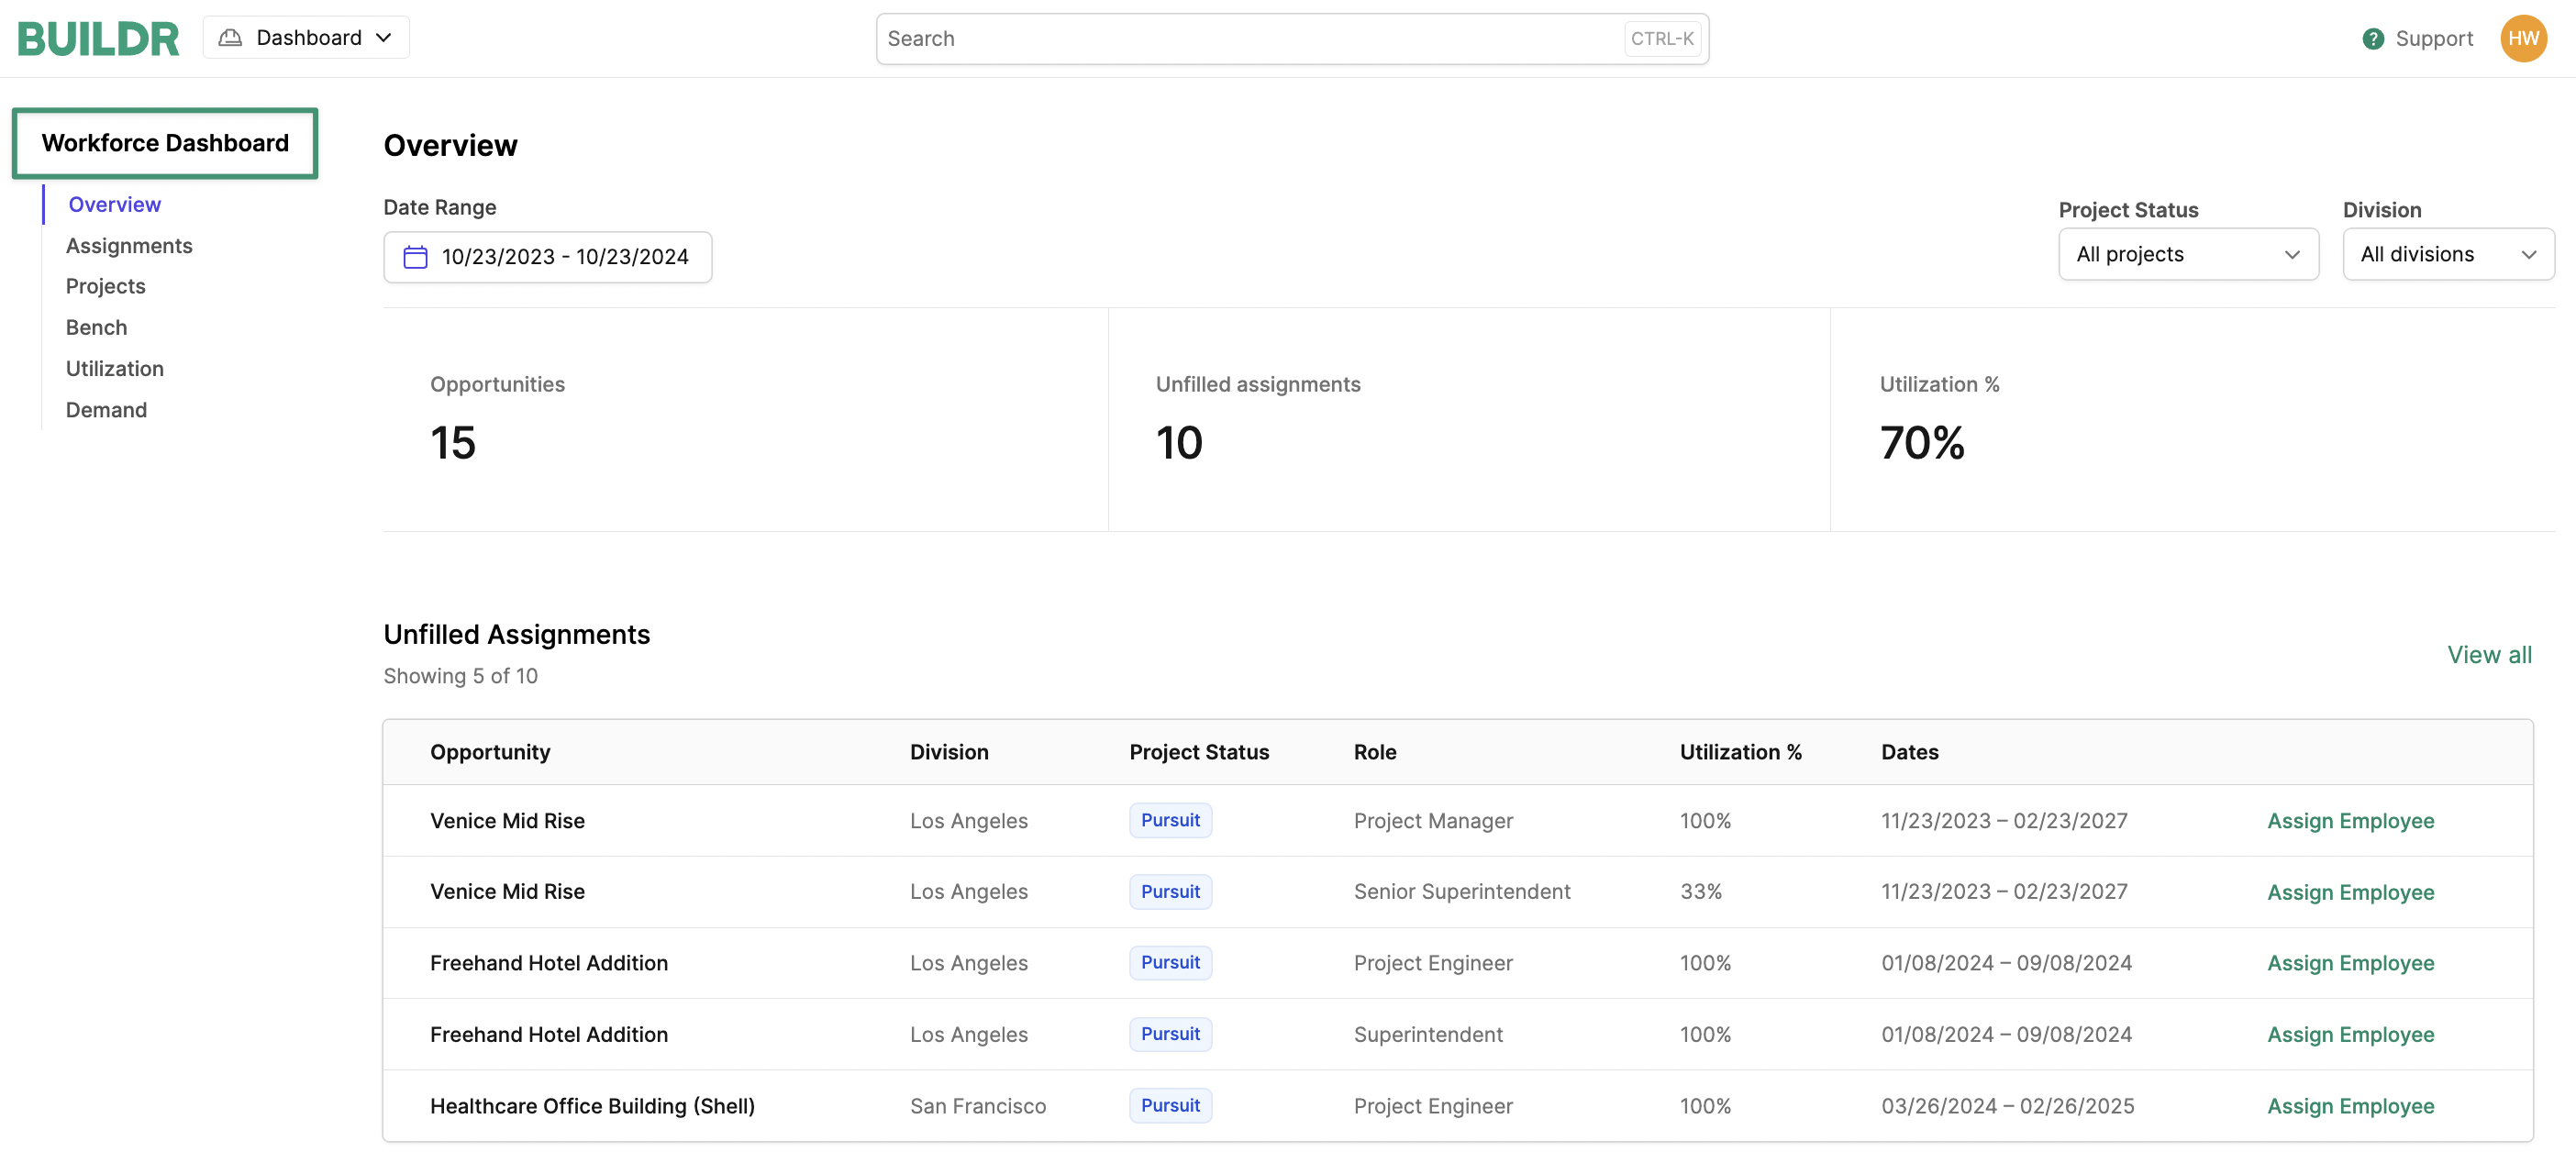
Unfilled Assignments
This section will highlight any open positions (no employee assigned) that start within the selected date range. In the example below, we can see that we need a Project Manager and a Senior Superintendent in the Los Angeles area for our Venice Mid Rise project starting on 11/23/2023. From this section, we can click on “Assign Employee” and fill that position without navigating away from the Dashboard.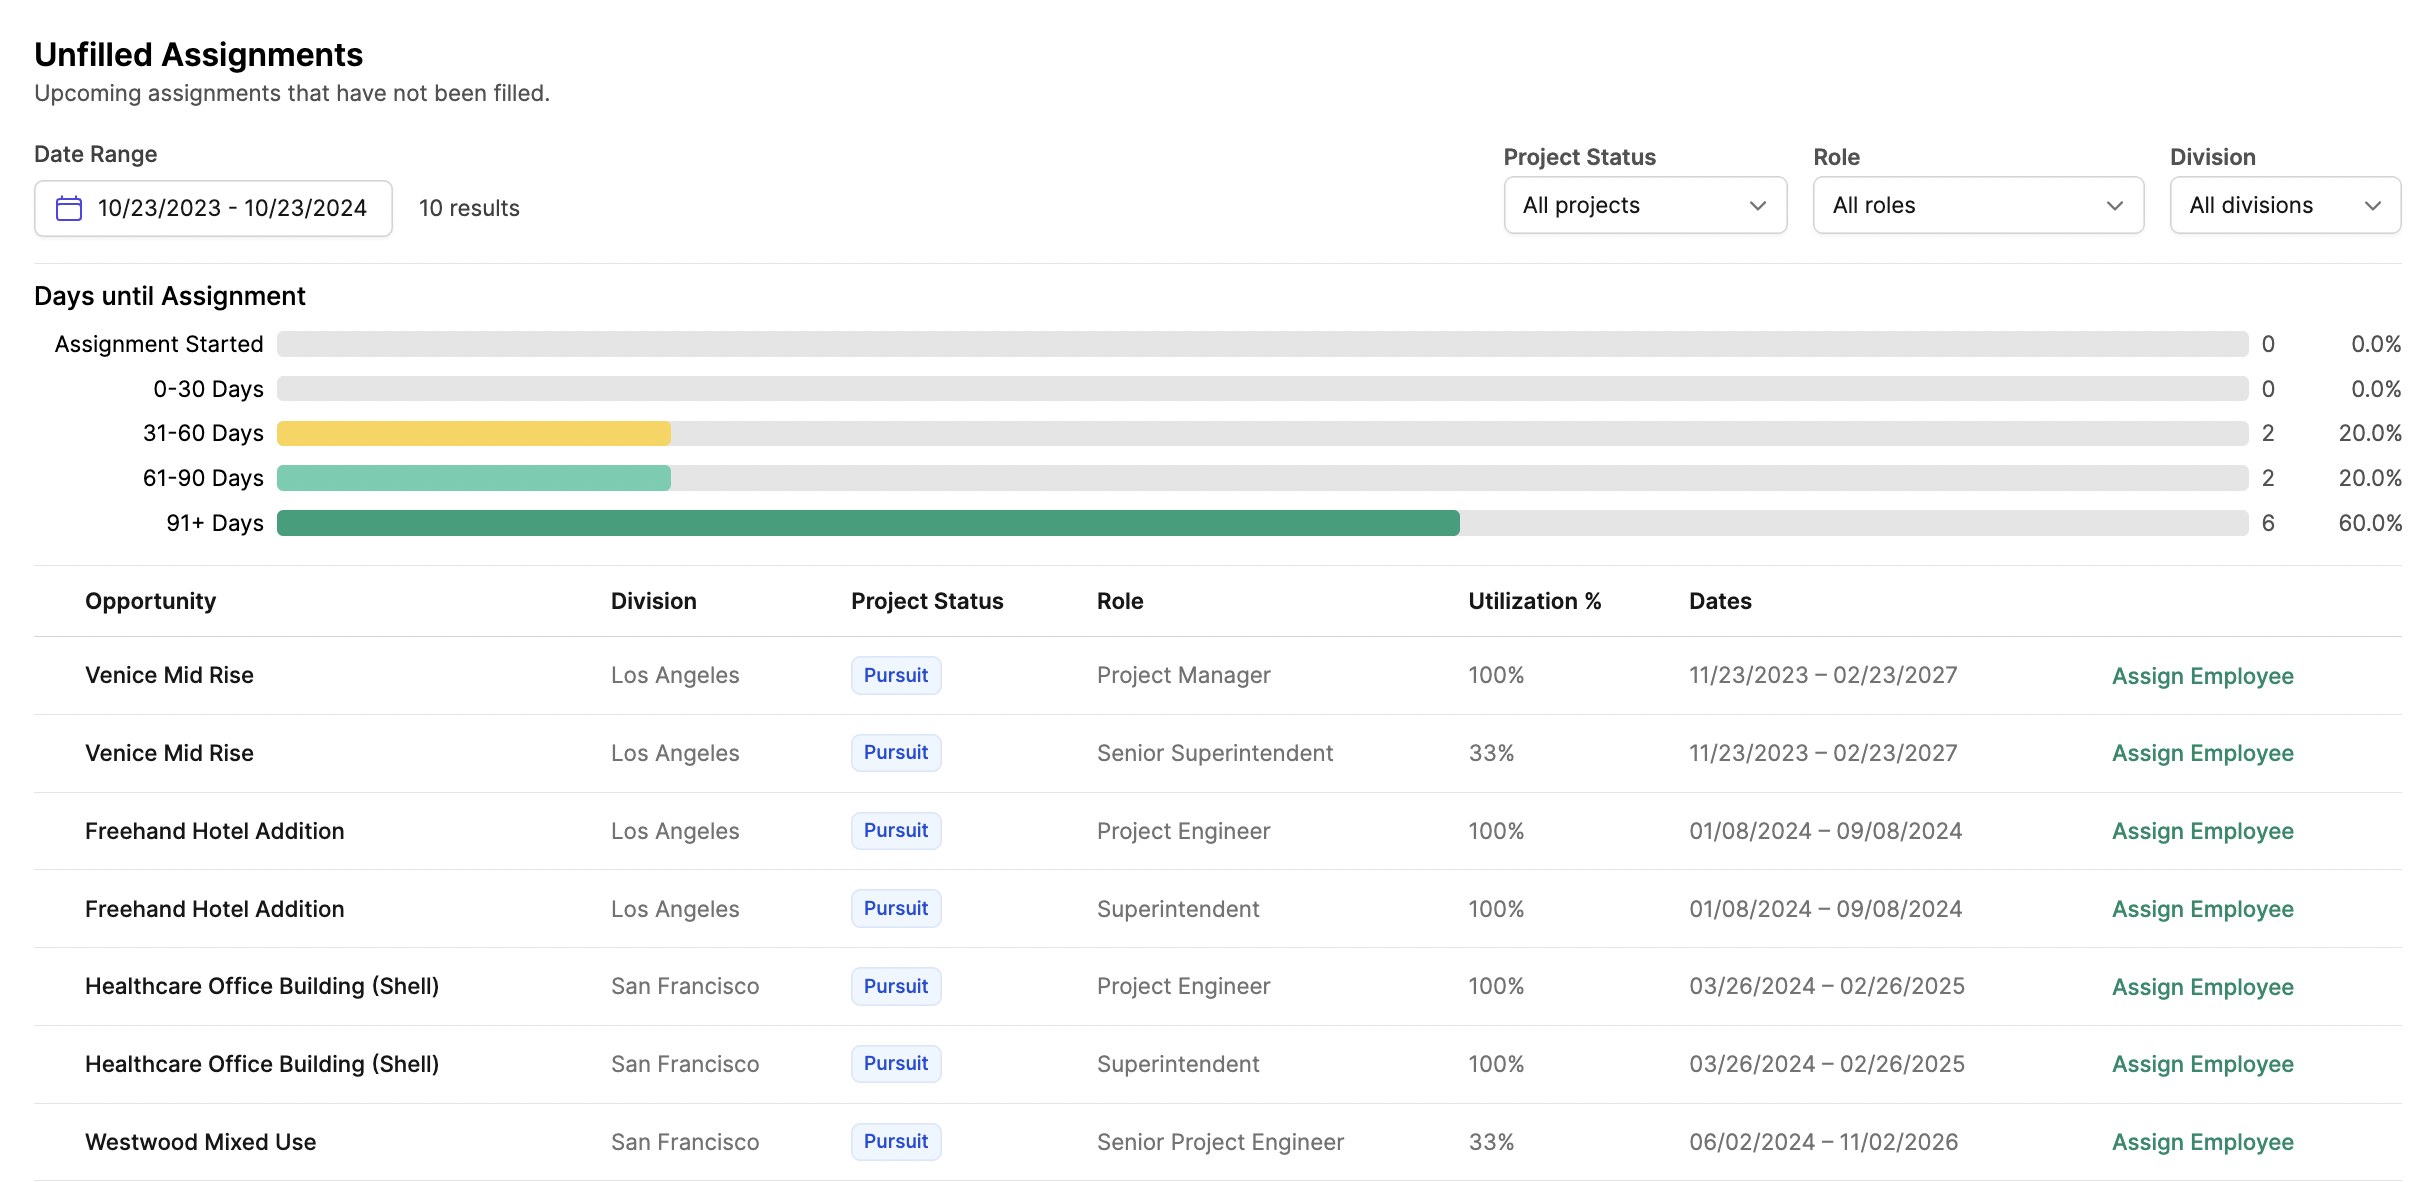
Project Breakdown
This section will show how many positions (Roles) have been created for each project and how many of those positions are filled. This section will also highlight any projects within the selected date range that do not have any assignments created. This helps to ensure that no projects will start without proper staffing.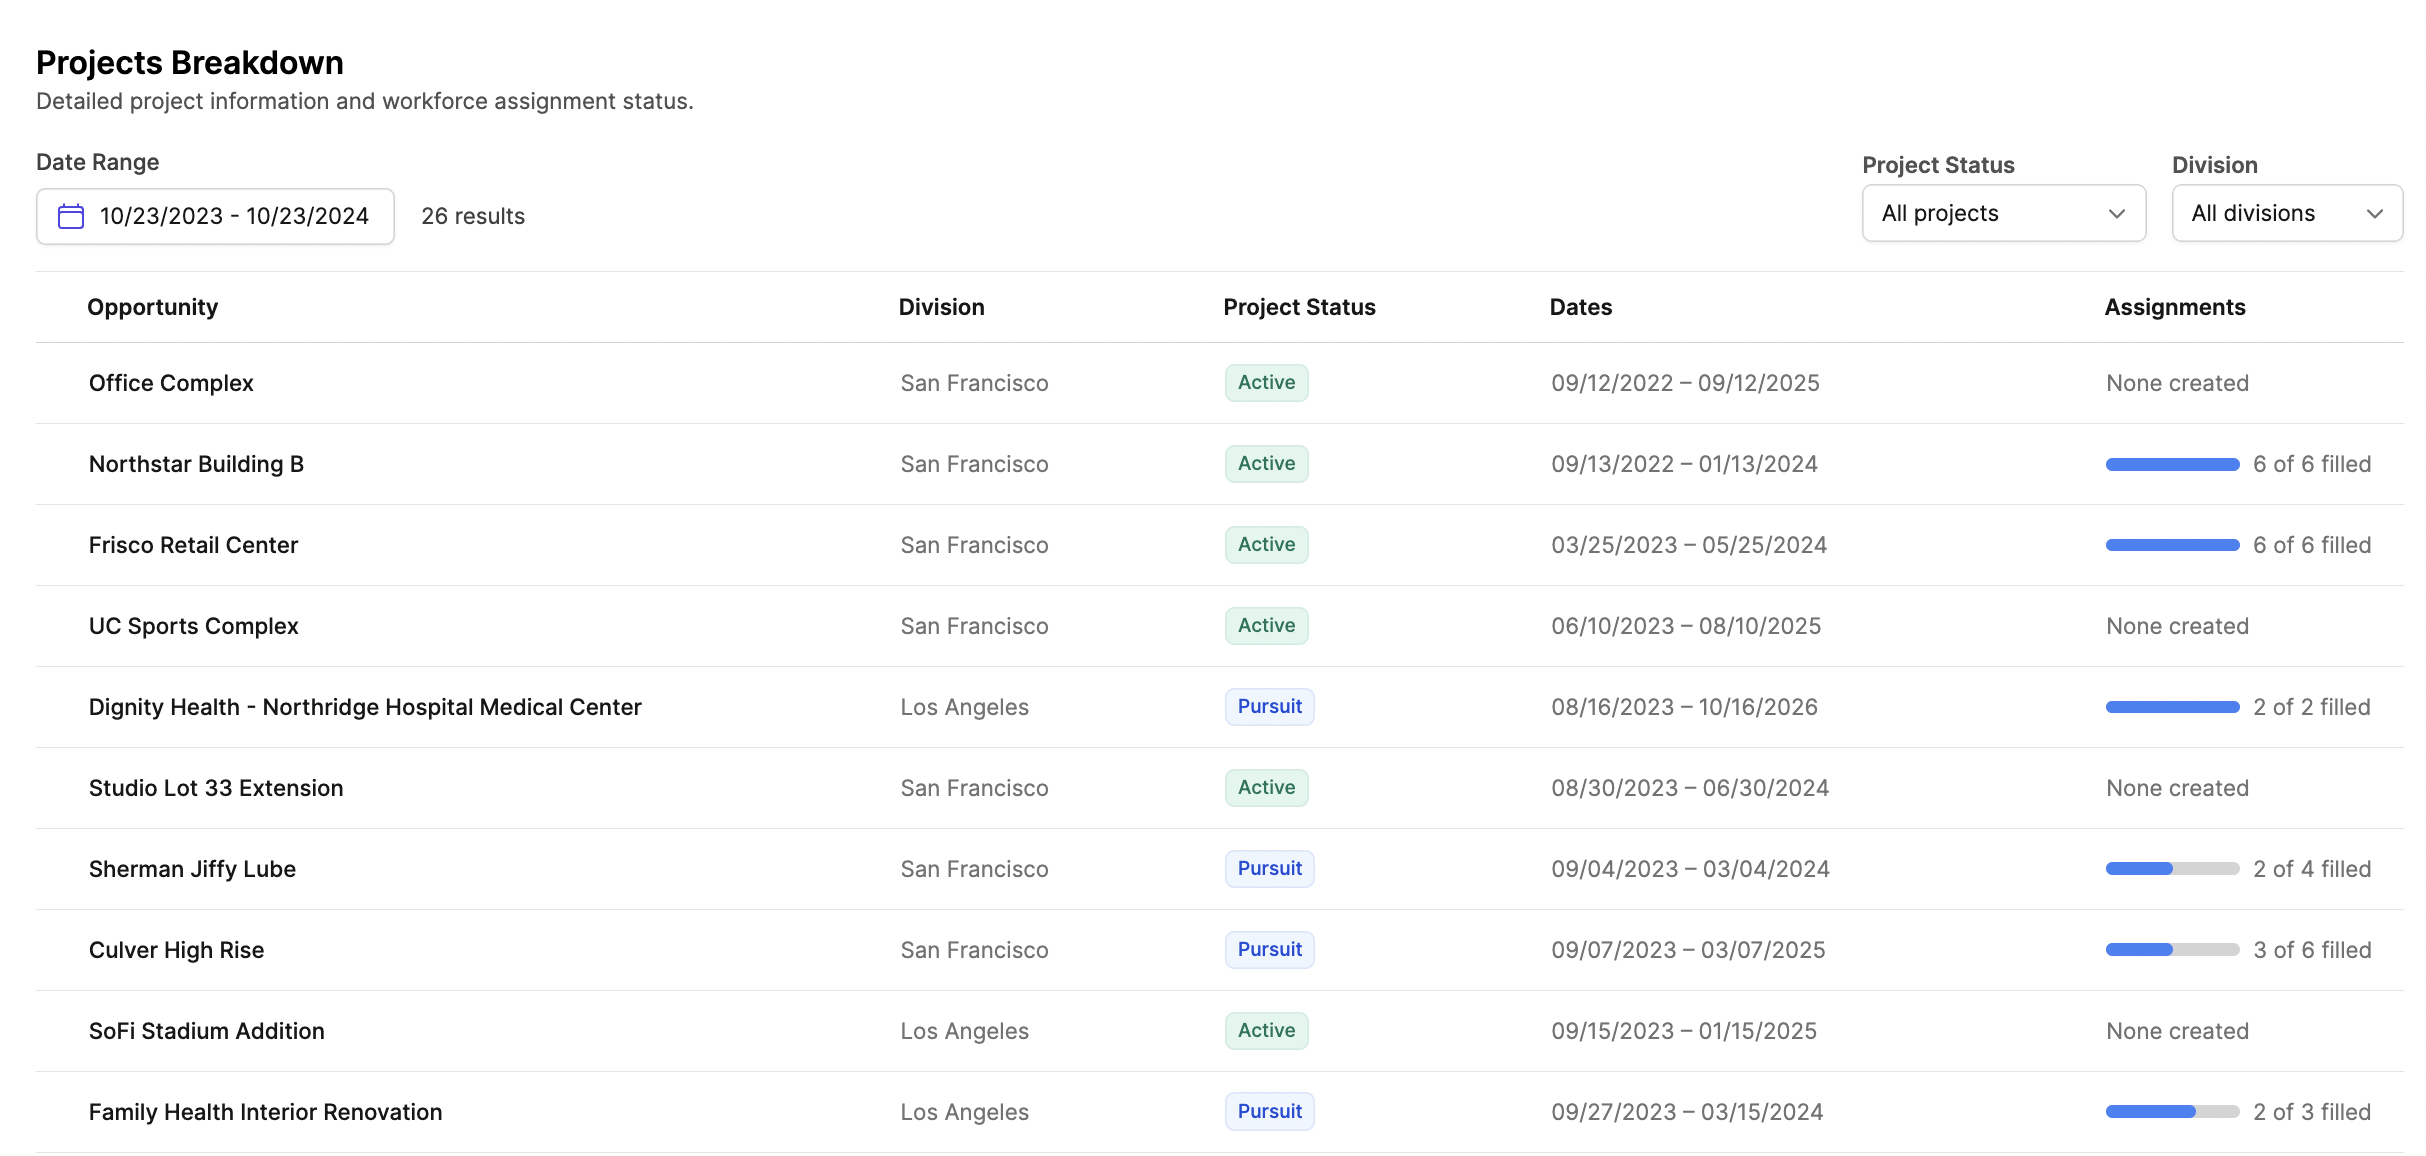
Employee Bench
This section will show any employees with large gaps of availability within the selected date range and what dates they are available for assignments. This helps to ensure that your entire labor force is being utilized efficiently.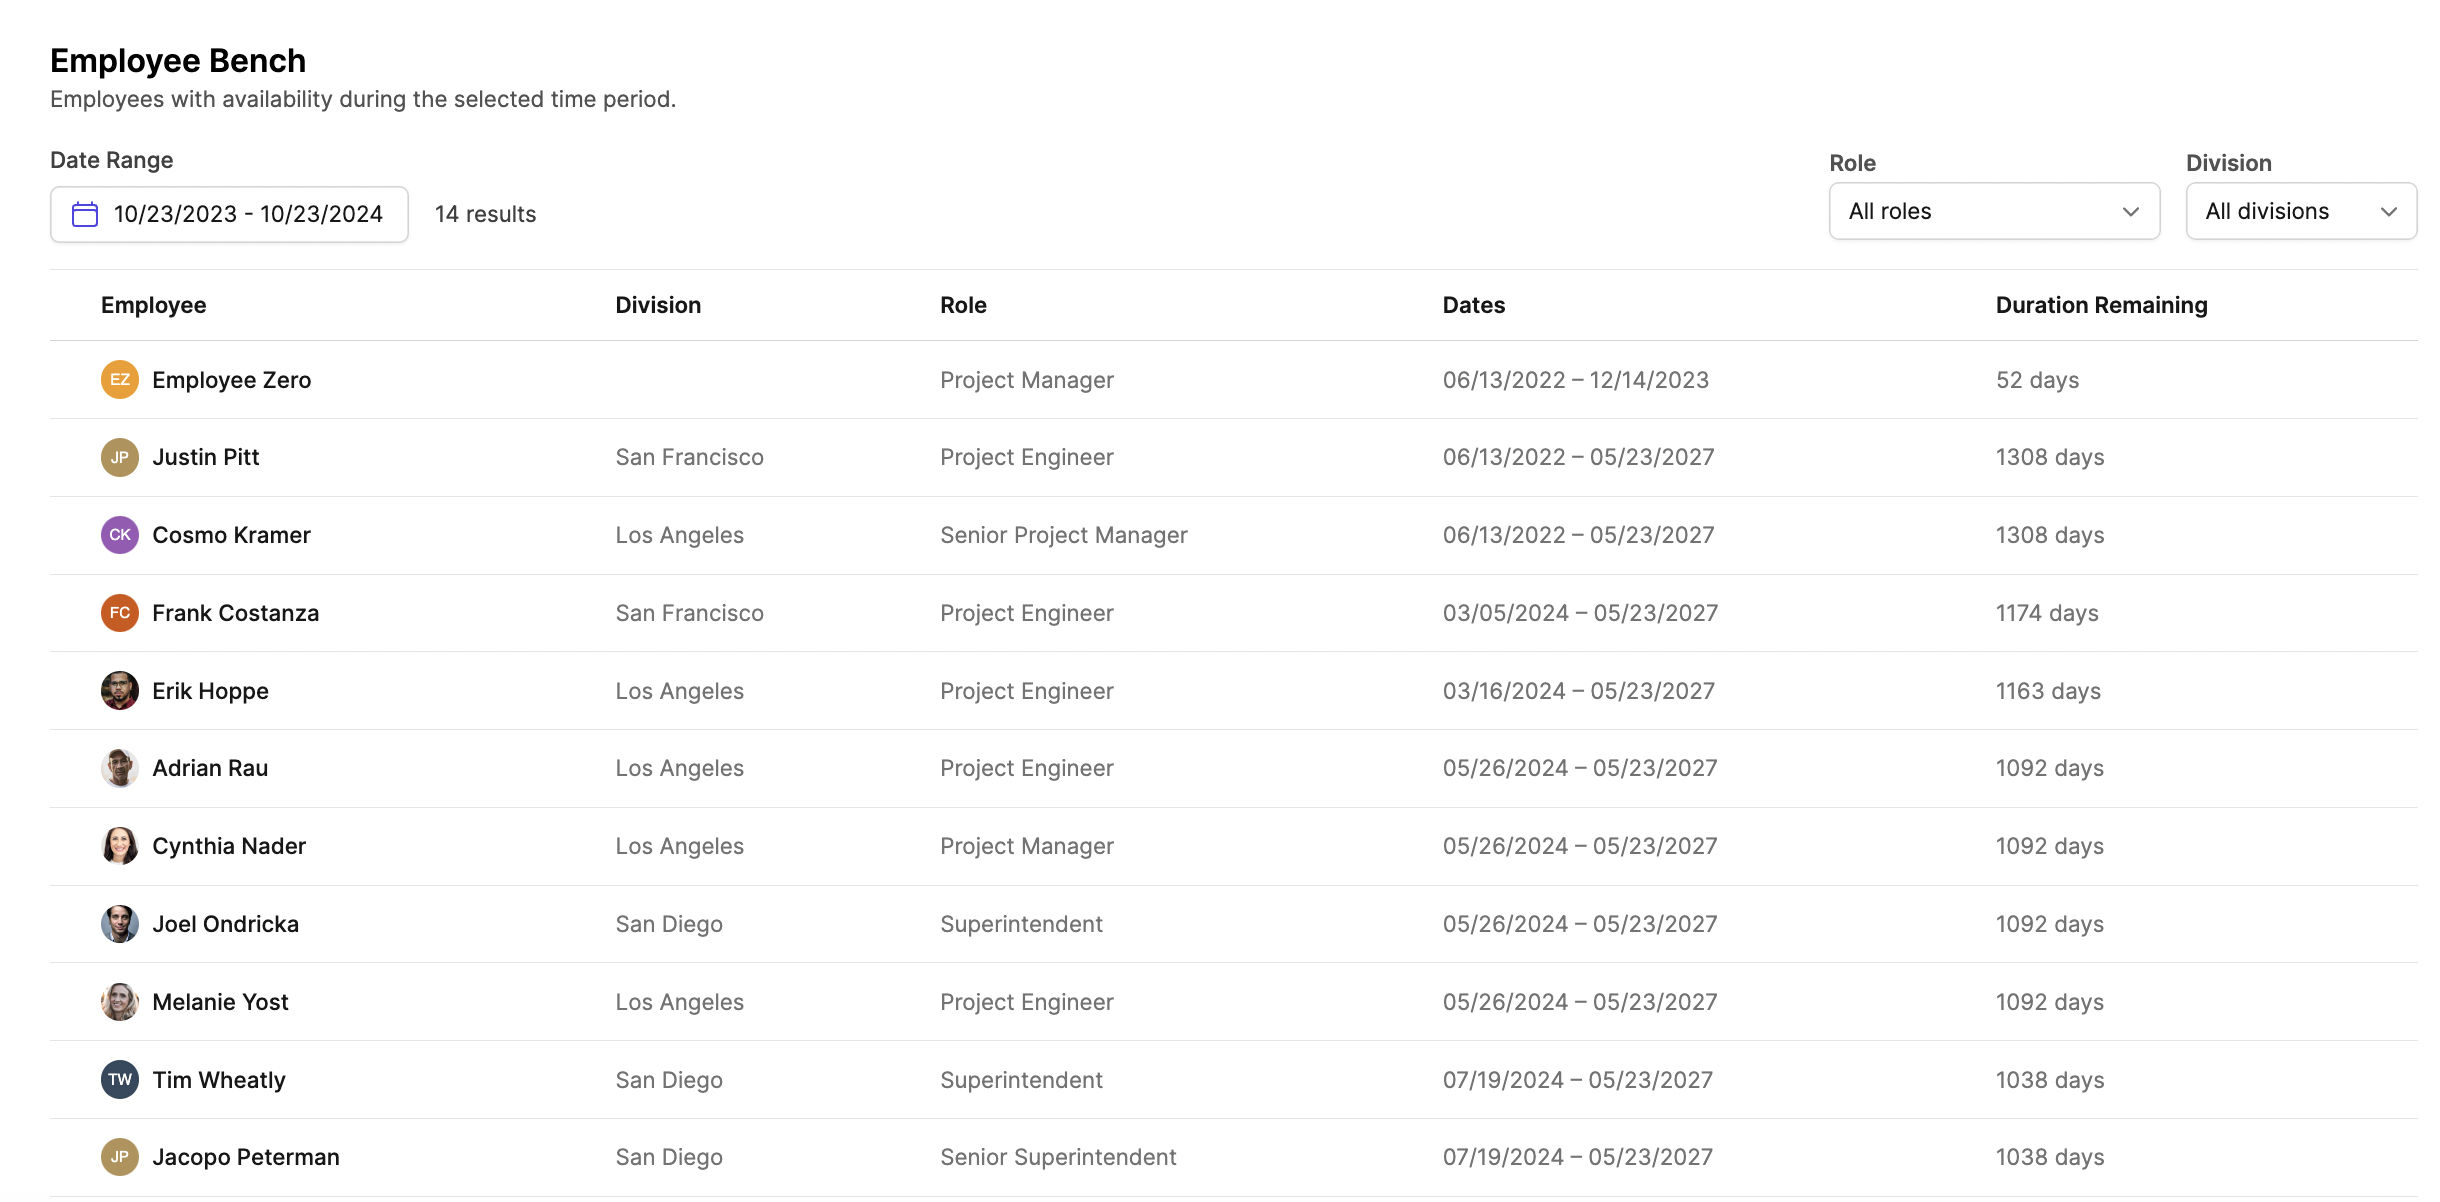
Utilization Chart
The Utilization Chart shows the total utilization of your workforce that is assigned to roles across all projects within the selected date range. If your utilization chart data shows low utilization for any time period, you can navigate to the Workforce Utilization tab to assign employees or reallocate any assignments from over-utilized employees to employees with availability.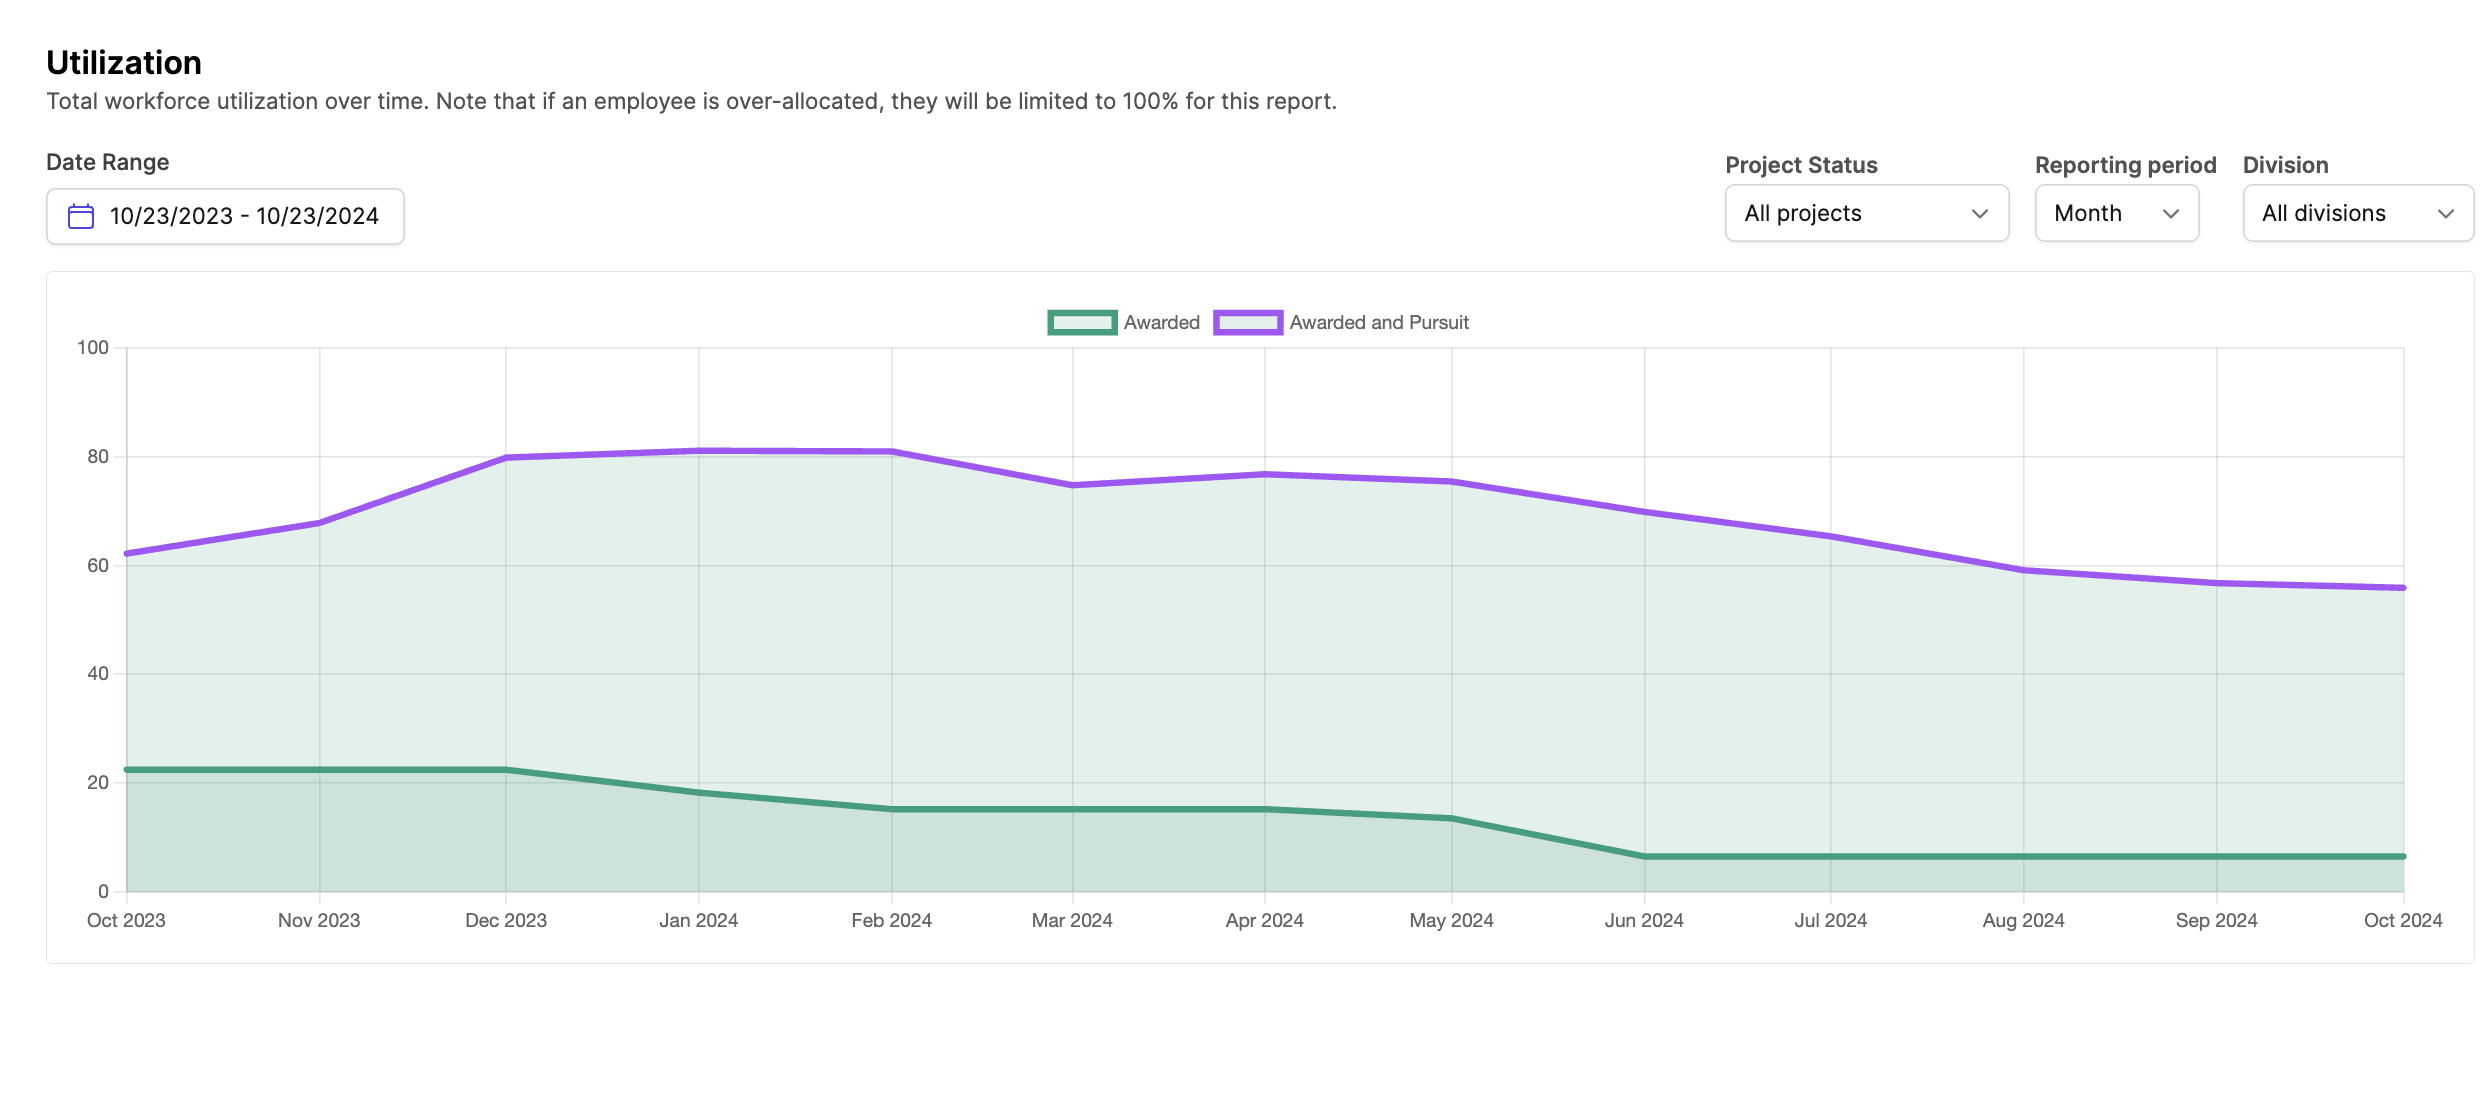
Demand Chart
The Demand chart is particularly useful because it shows you the number of employees you have compared to workforce demand due to awarded and pursuit projects within the selected date range. The green bar represents the number of employees necessary to fill the assignments on awarded projects. The blue bar represents the number of employees necessary to fill the assignments on pursuit stage projects.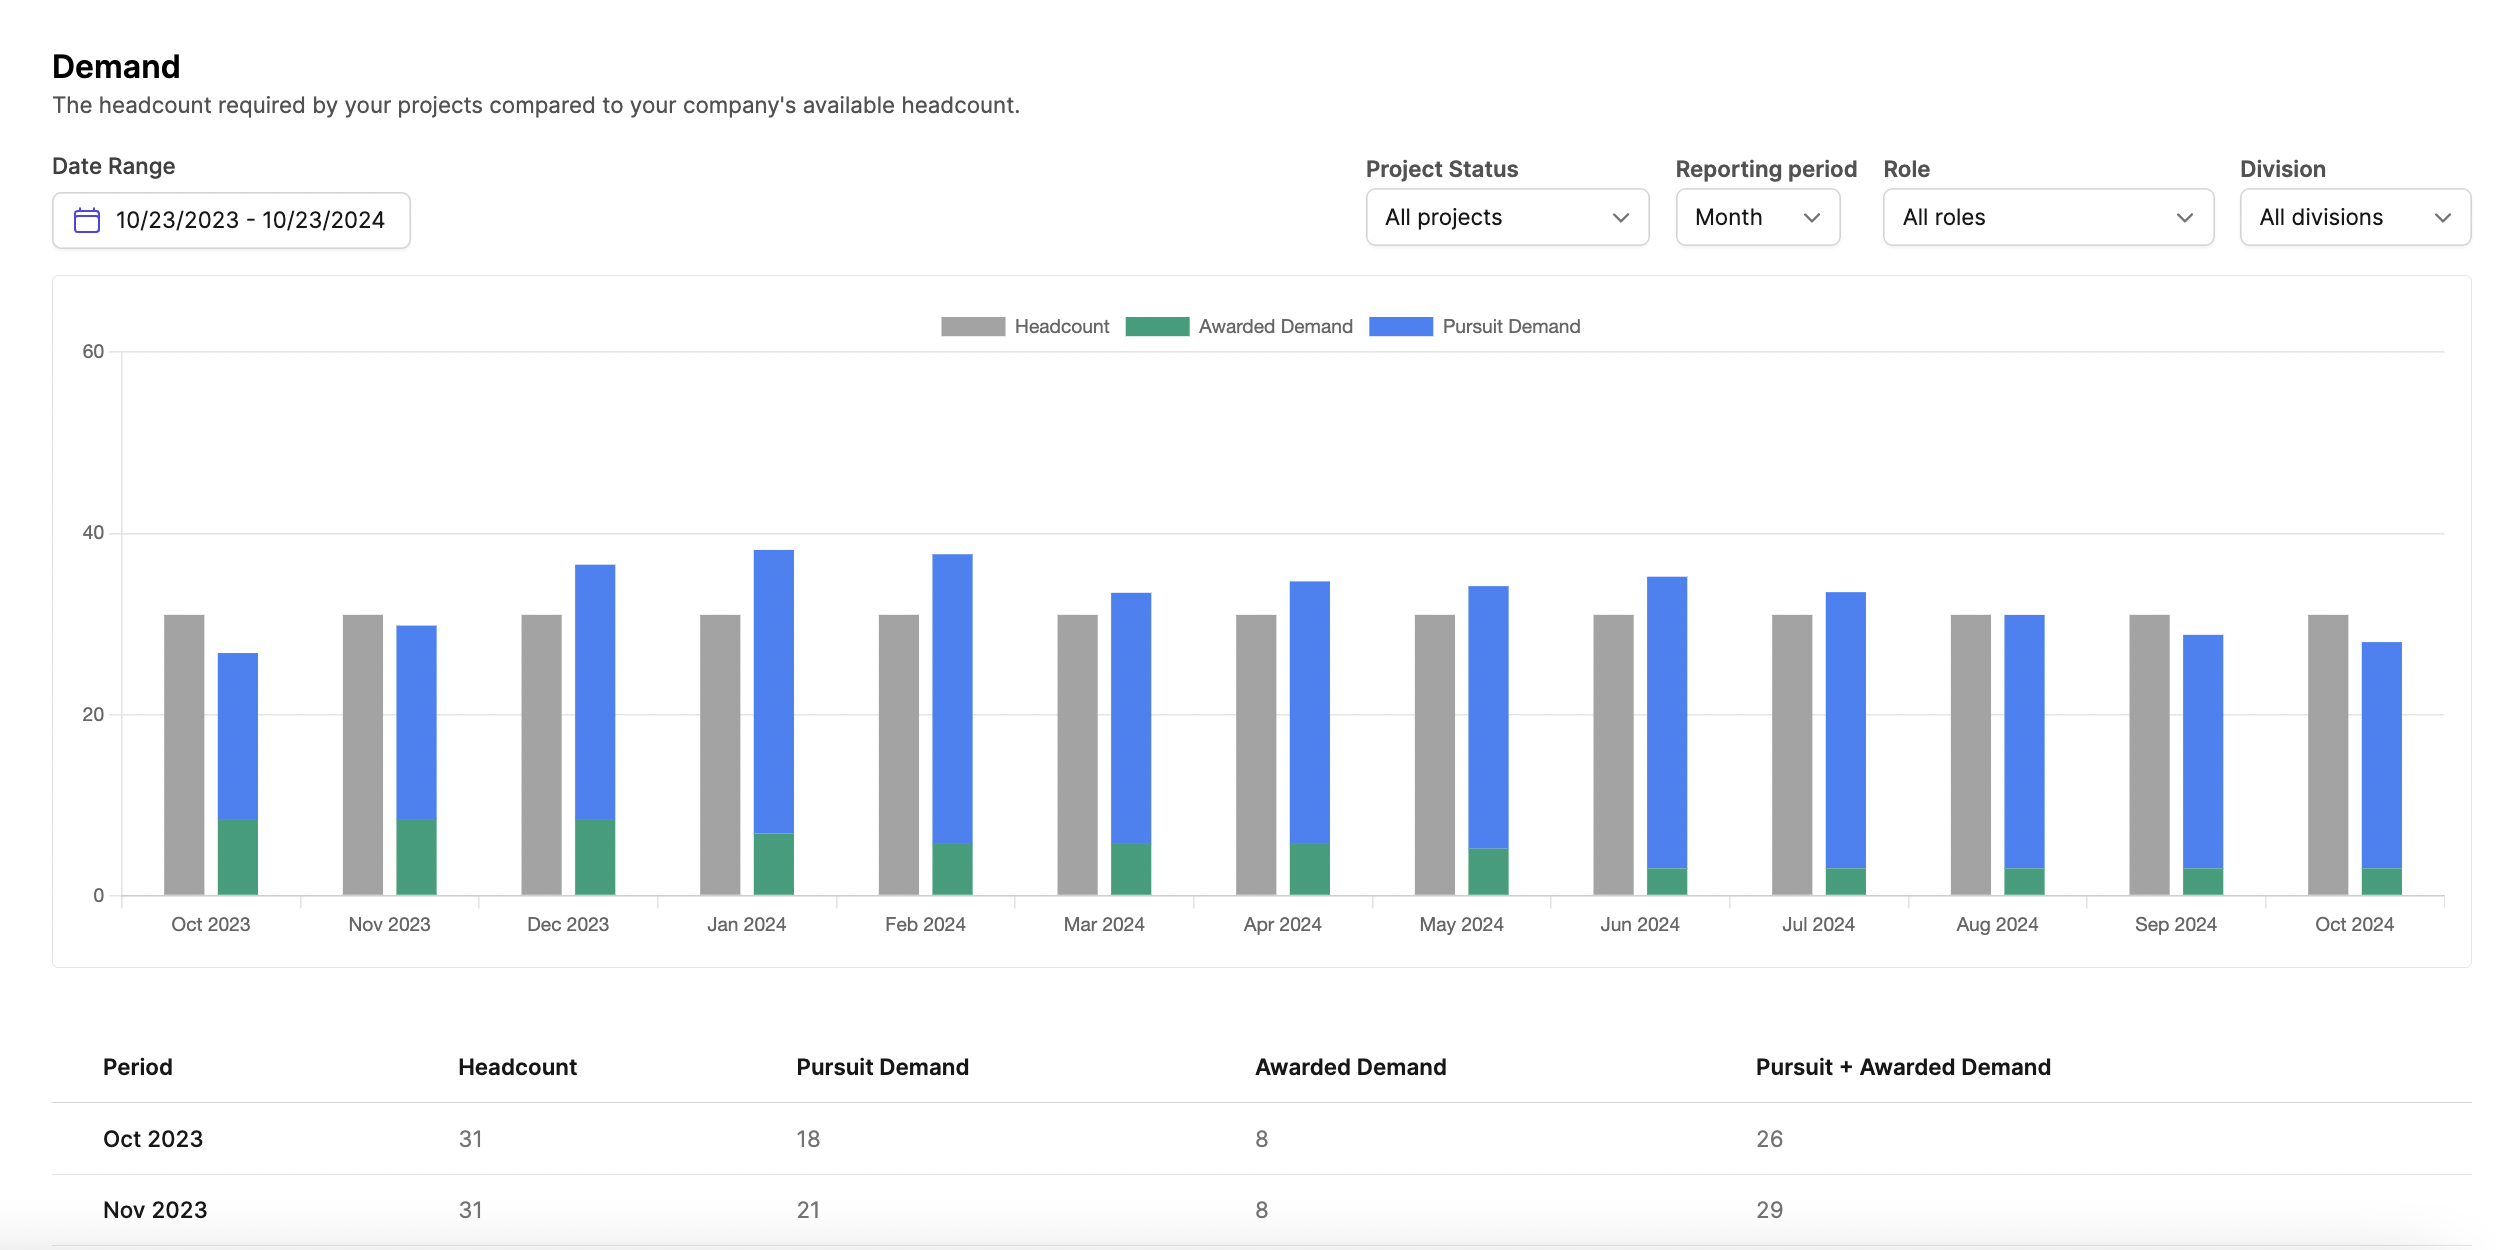
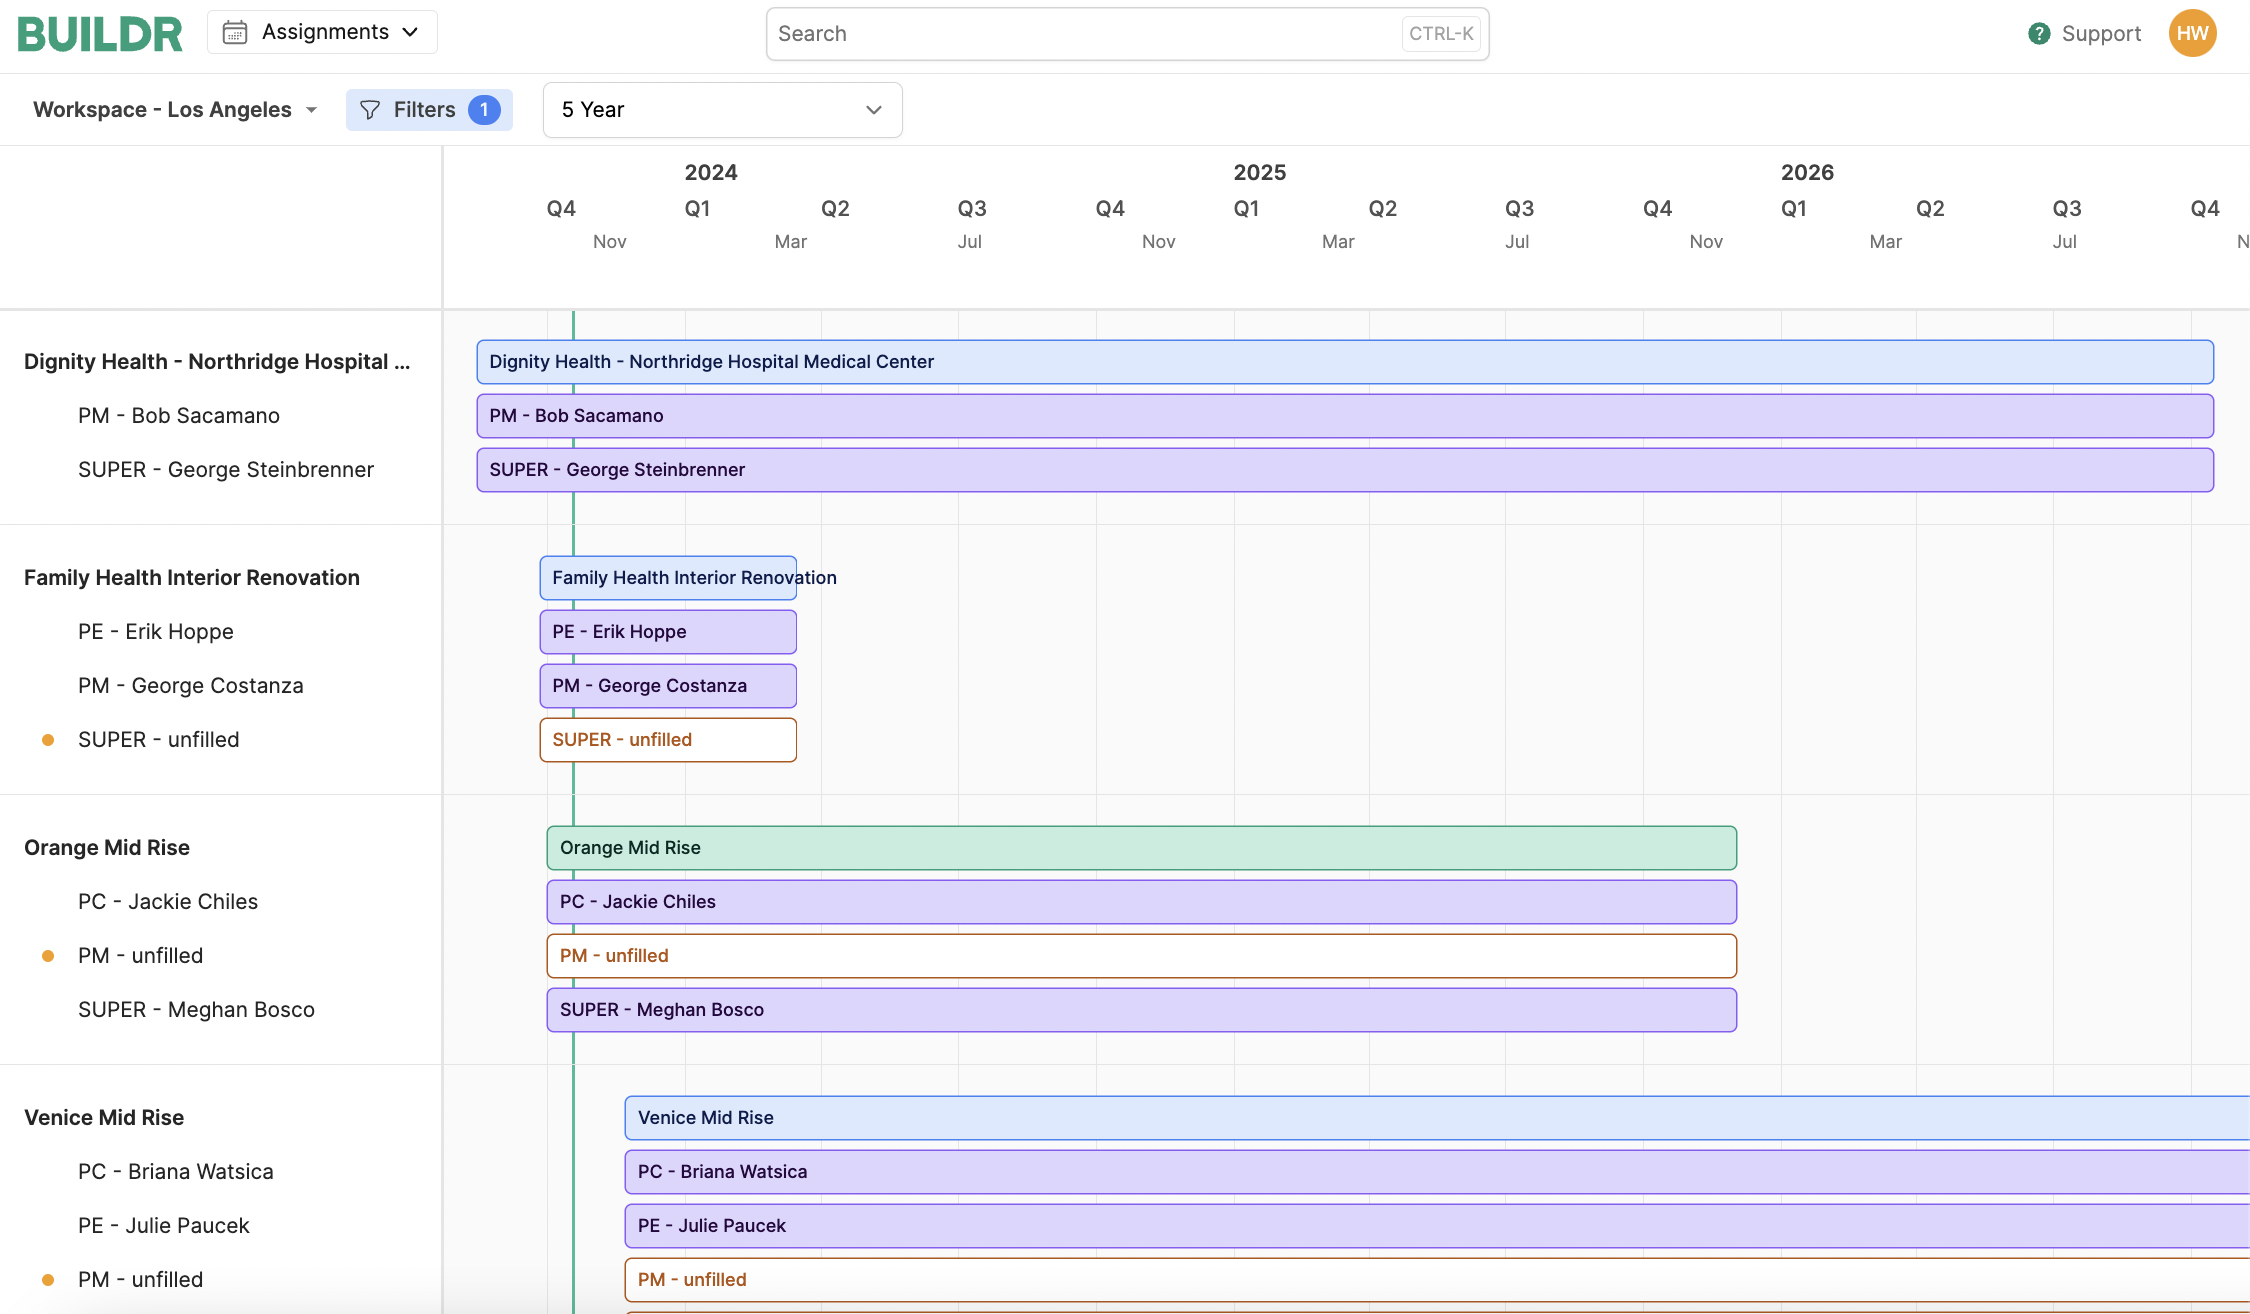
Assignments
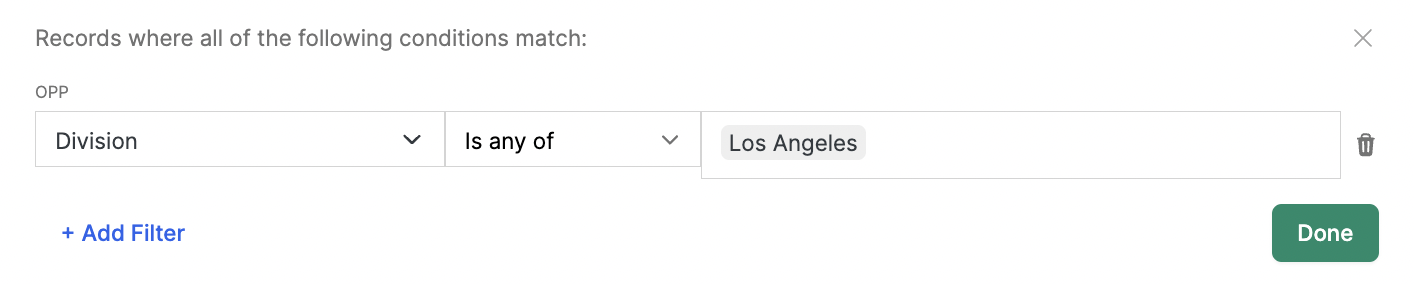
The Assignments tab allows you to track which Roles (PM’s, PC’s, Supers, etc.) have been filled on each Project. This ensures that each job and project has the proper allocation of resources.Division-dependent Views
Keep track of all projects and their labor force within a specific division or workspace.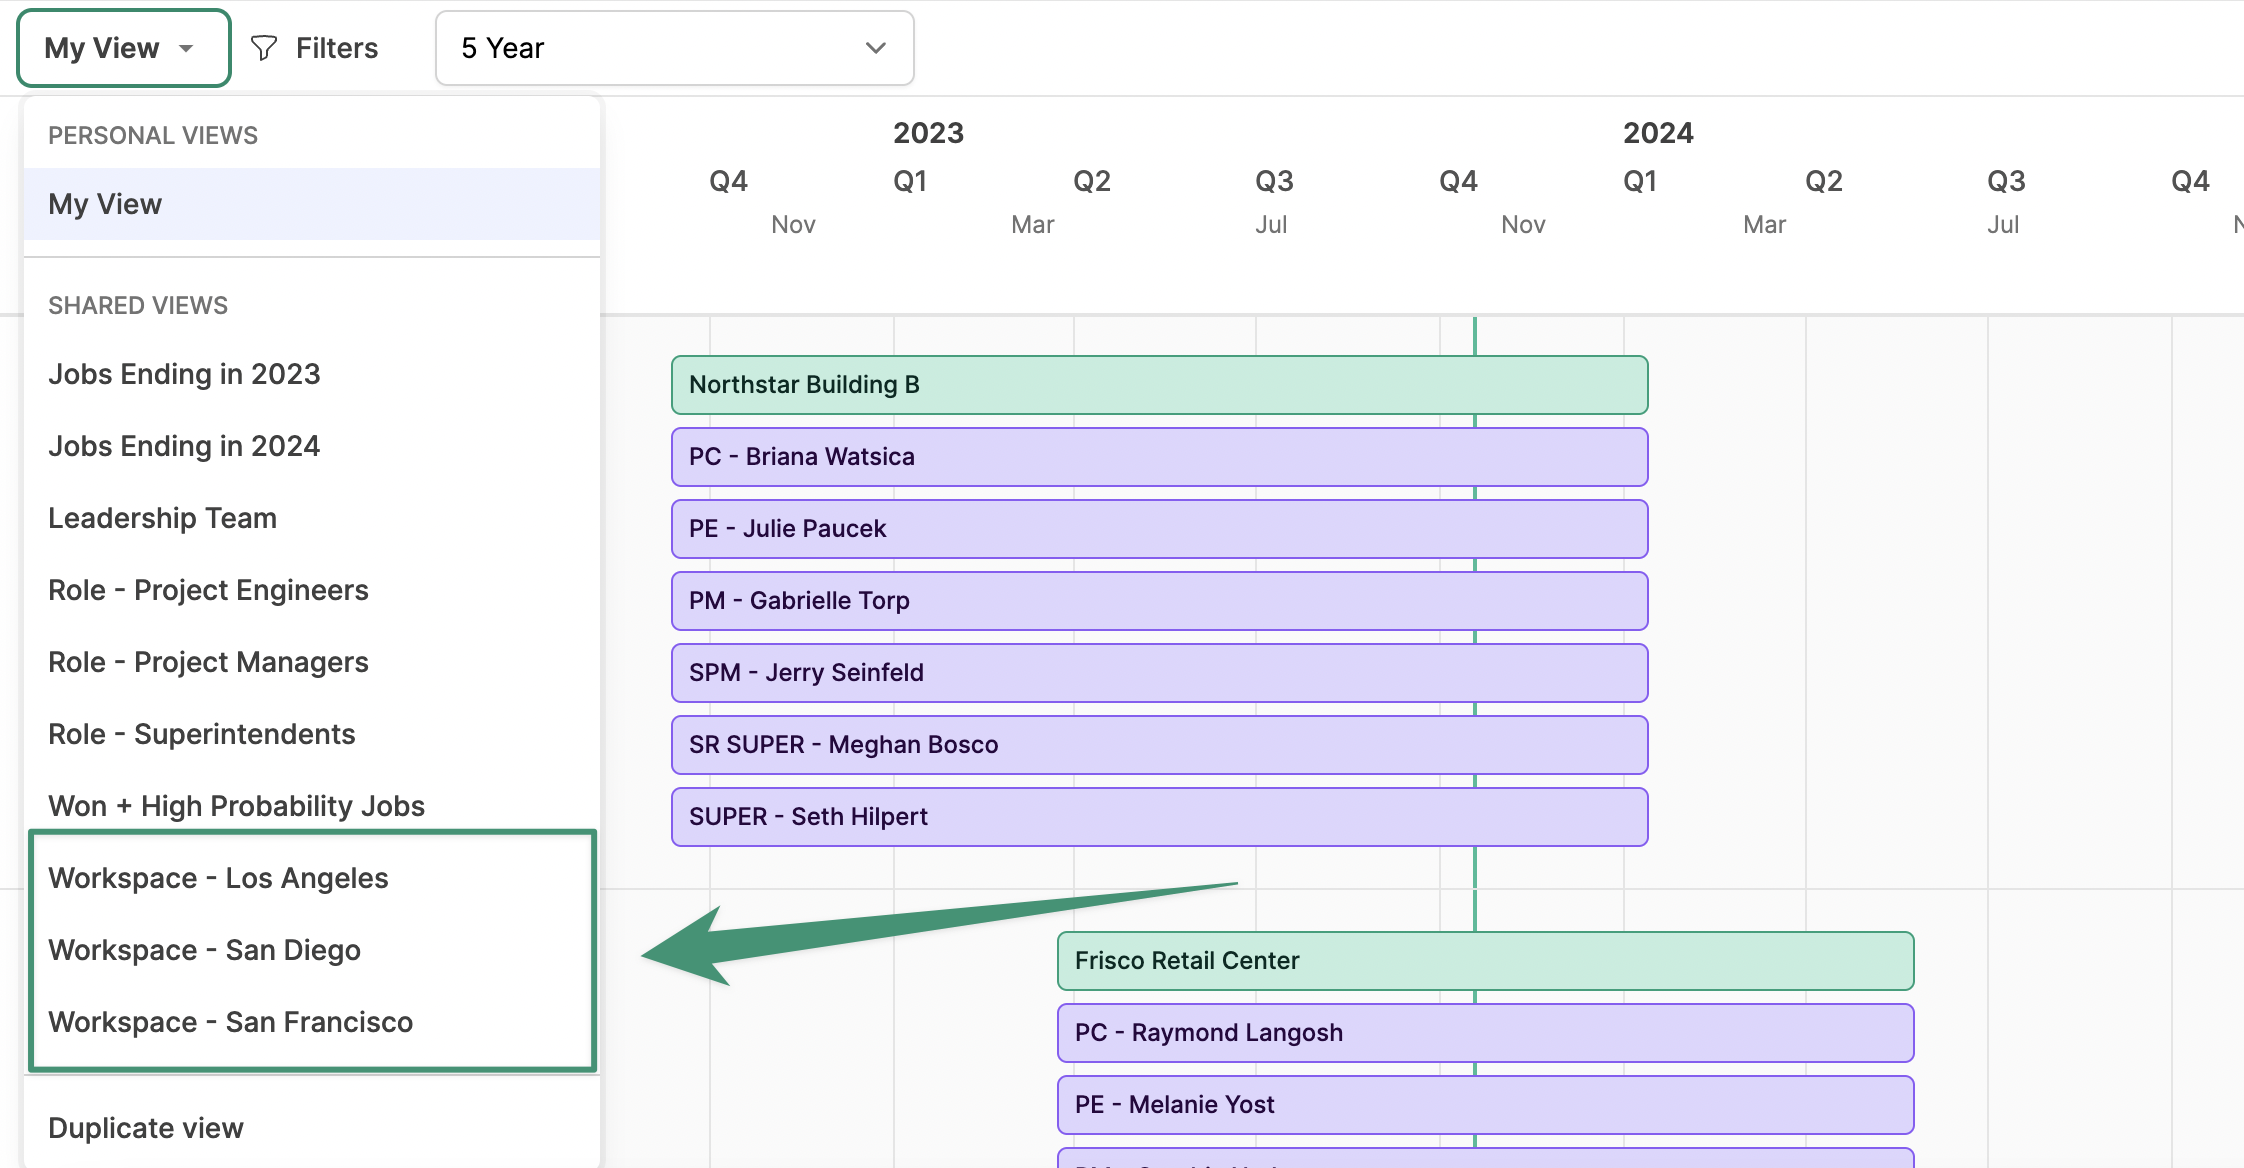
Role-dependent Views
See all assigned and available Project Management, Project Engineering, or Superintendent positions for each project.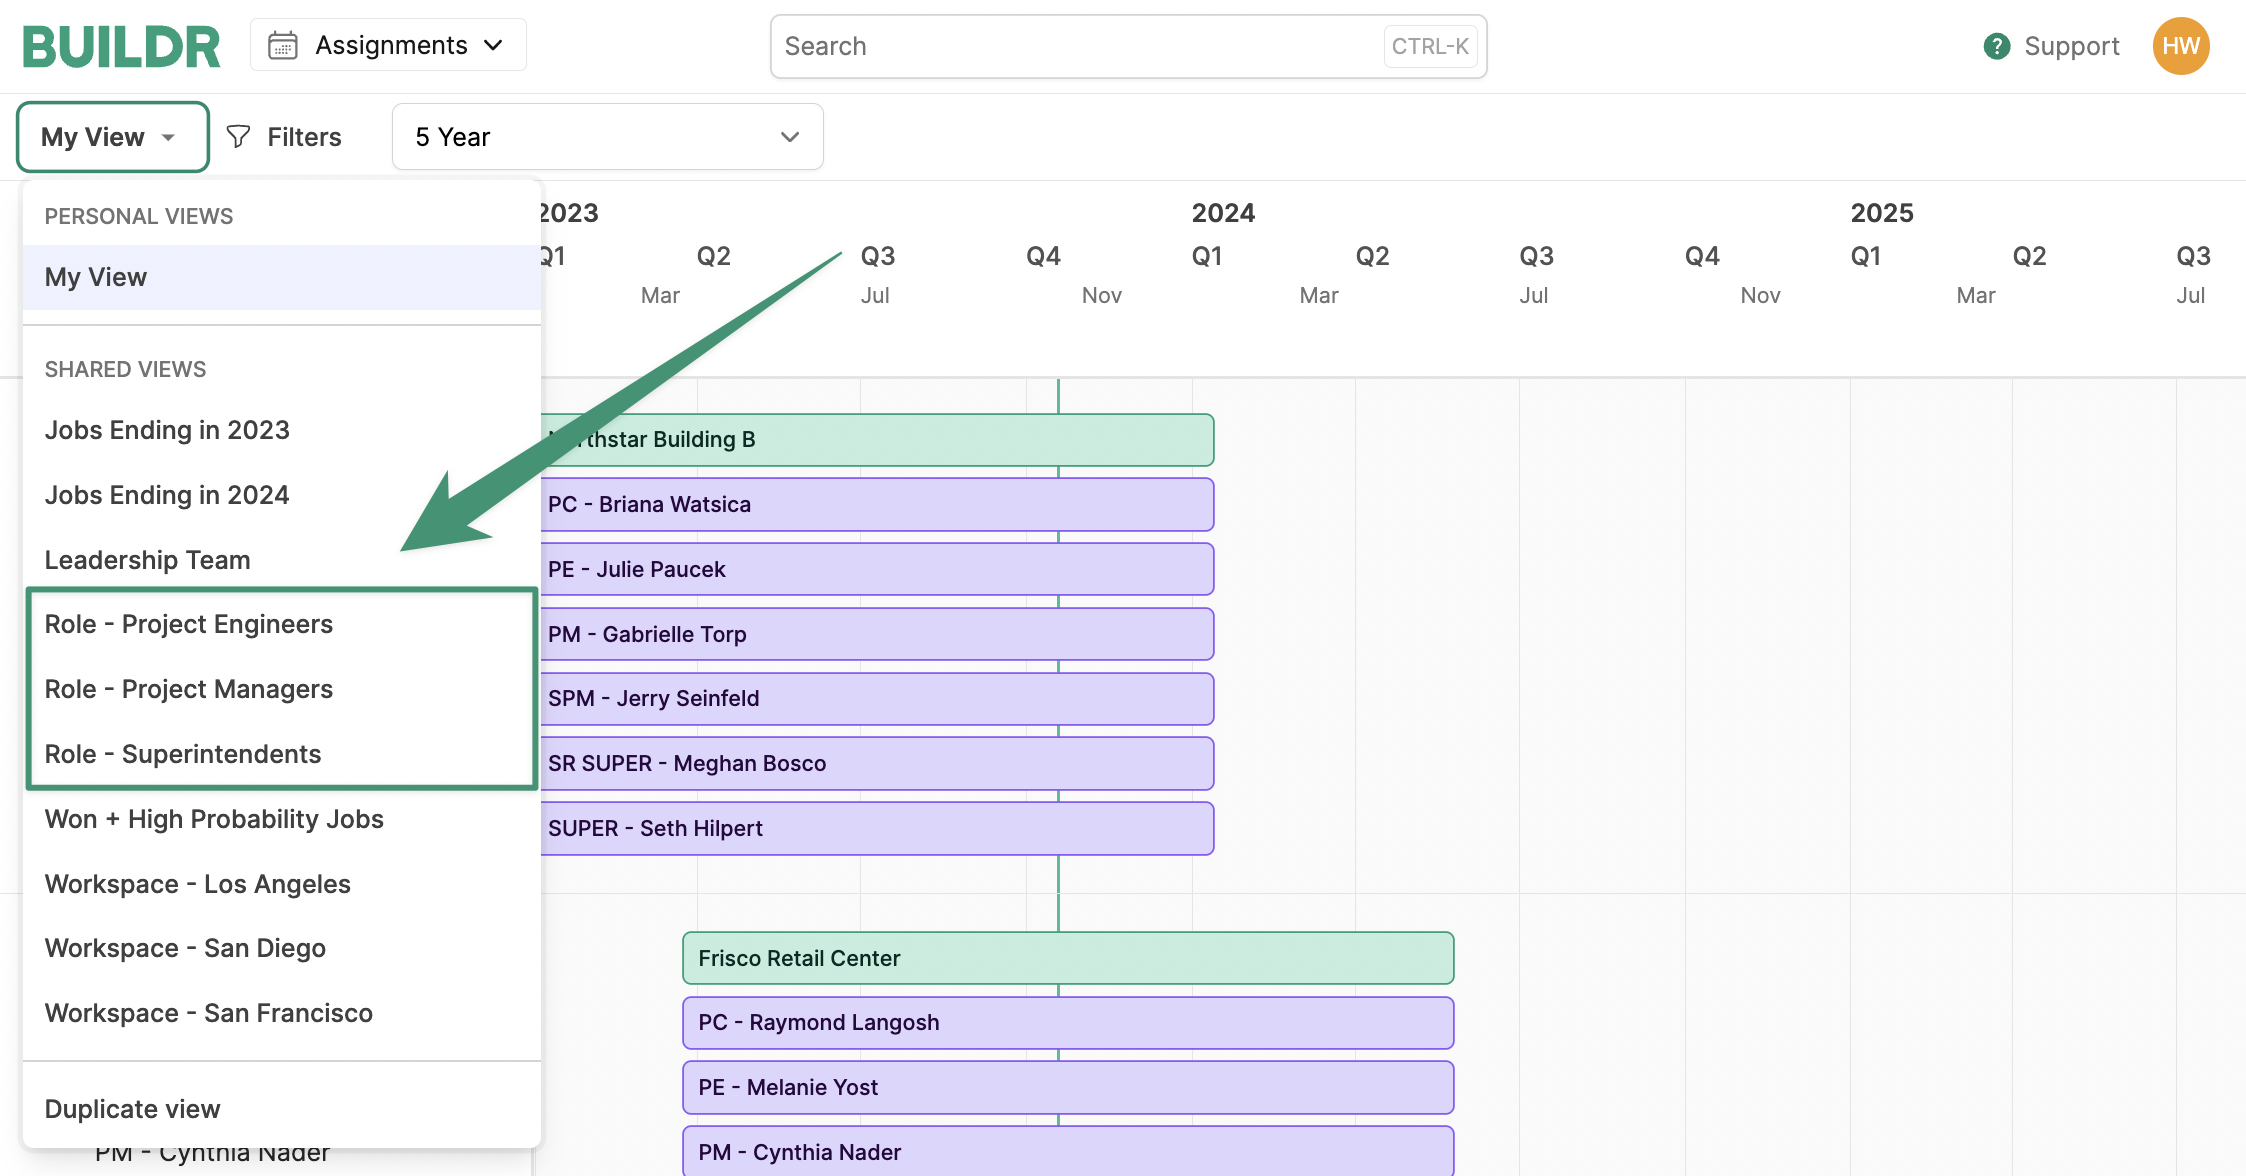
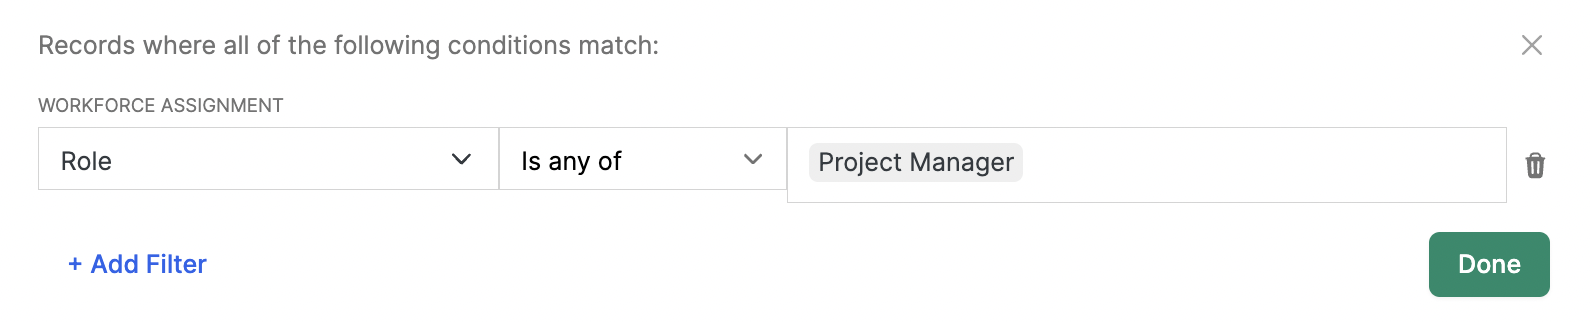
Role - Project Managers
See all projects with an assigned or unfilled Project Manager position.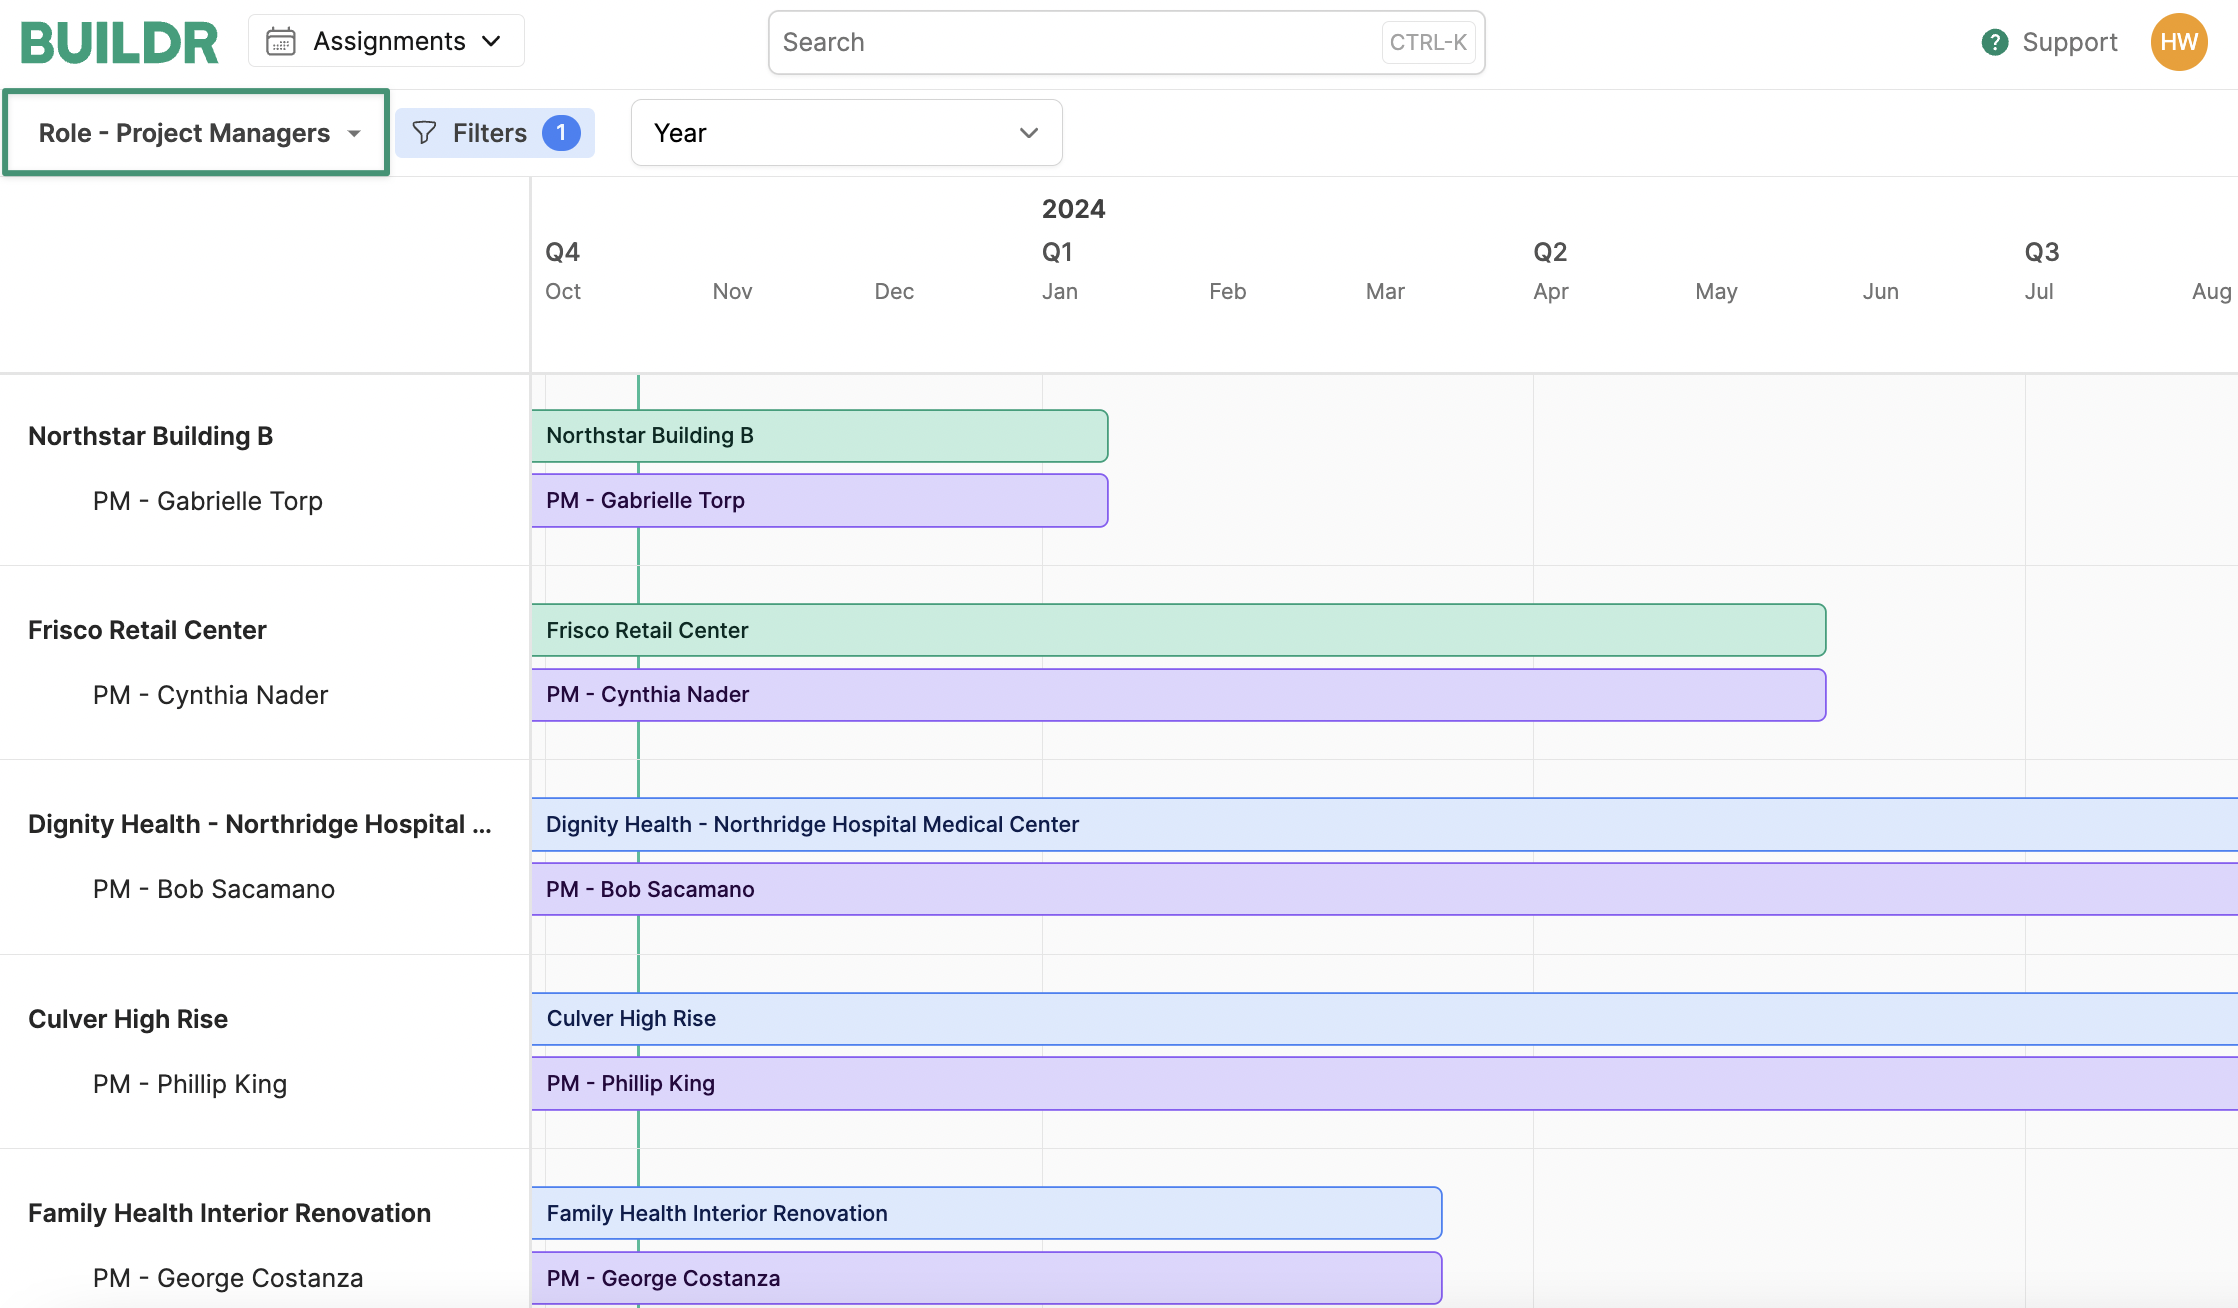
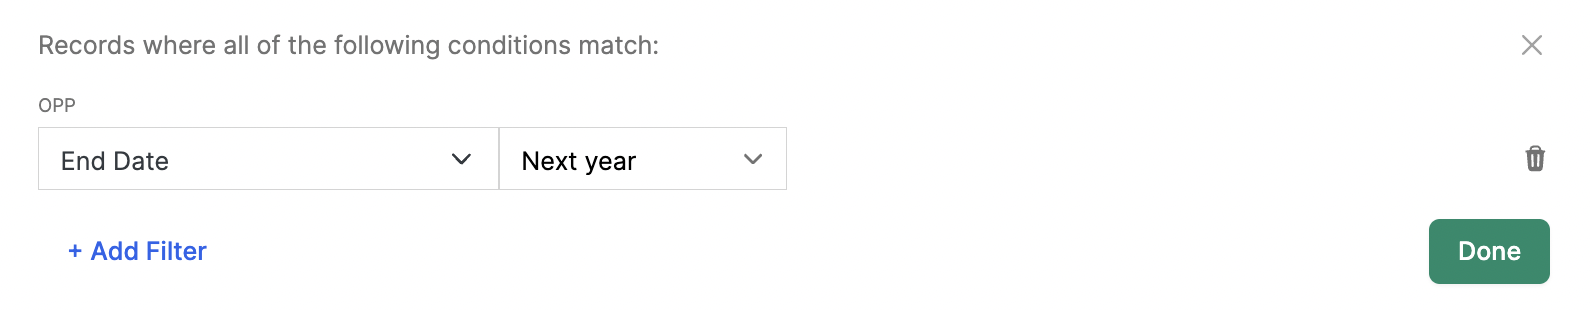
Time-dependent Views
See all jobs that are coming to a wrap this year to keep an eye on which employees will be available shortly.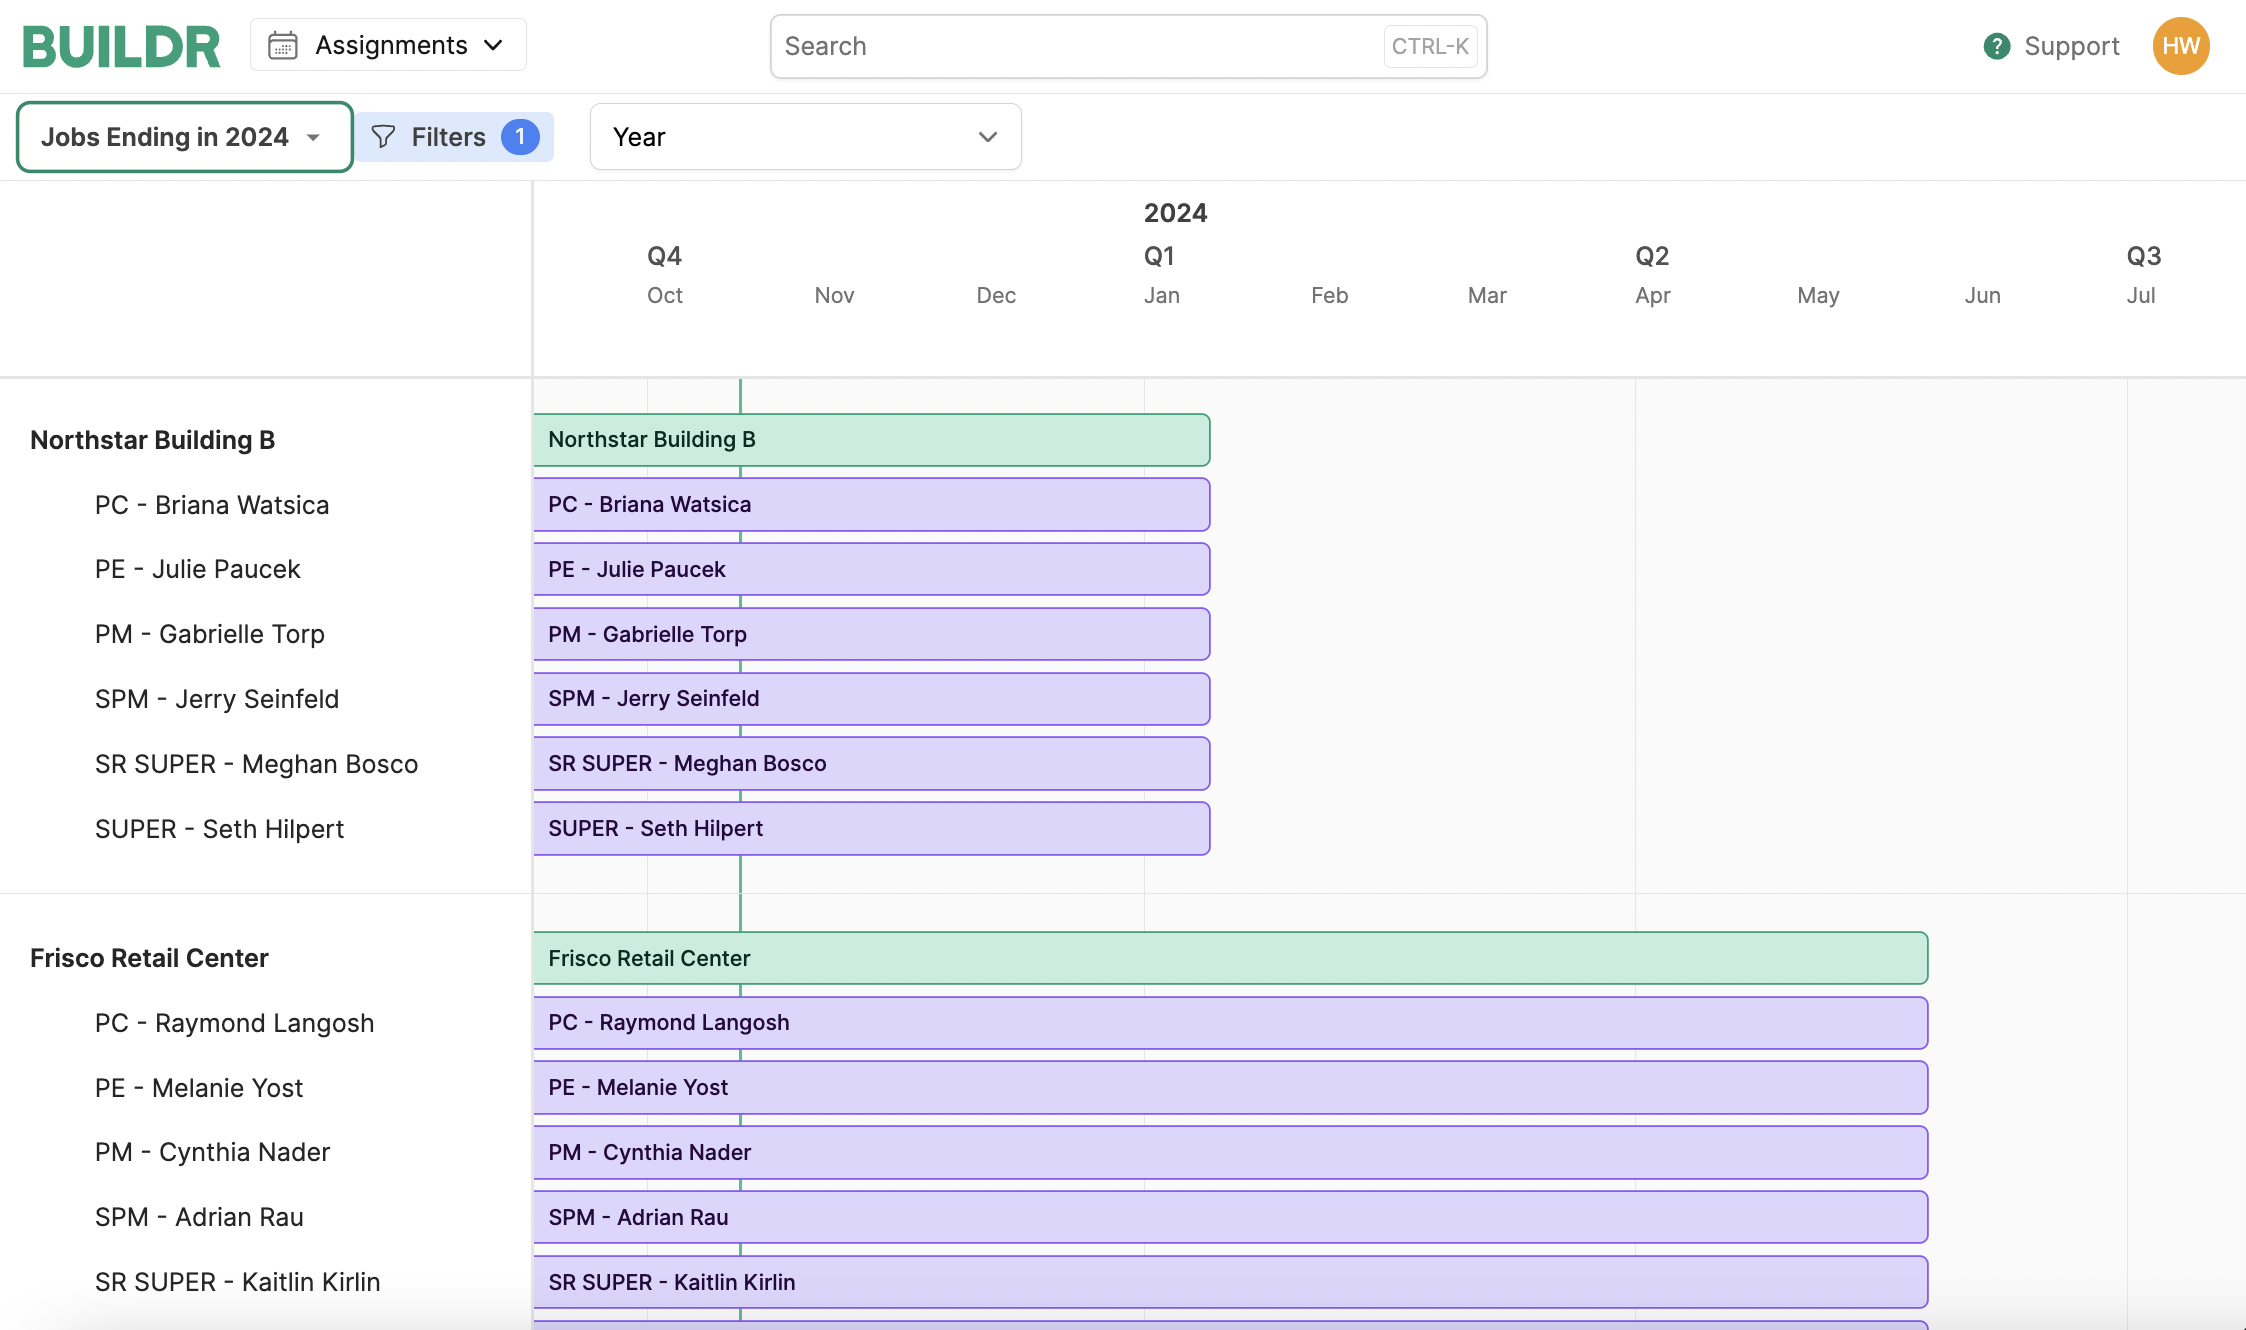
Utilization
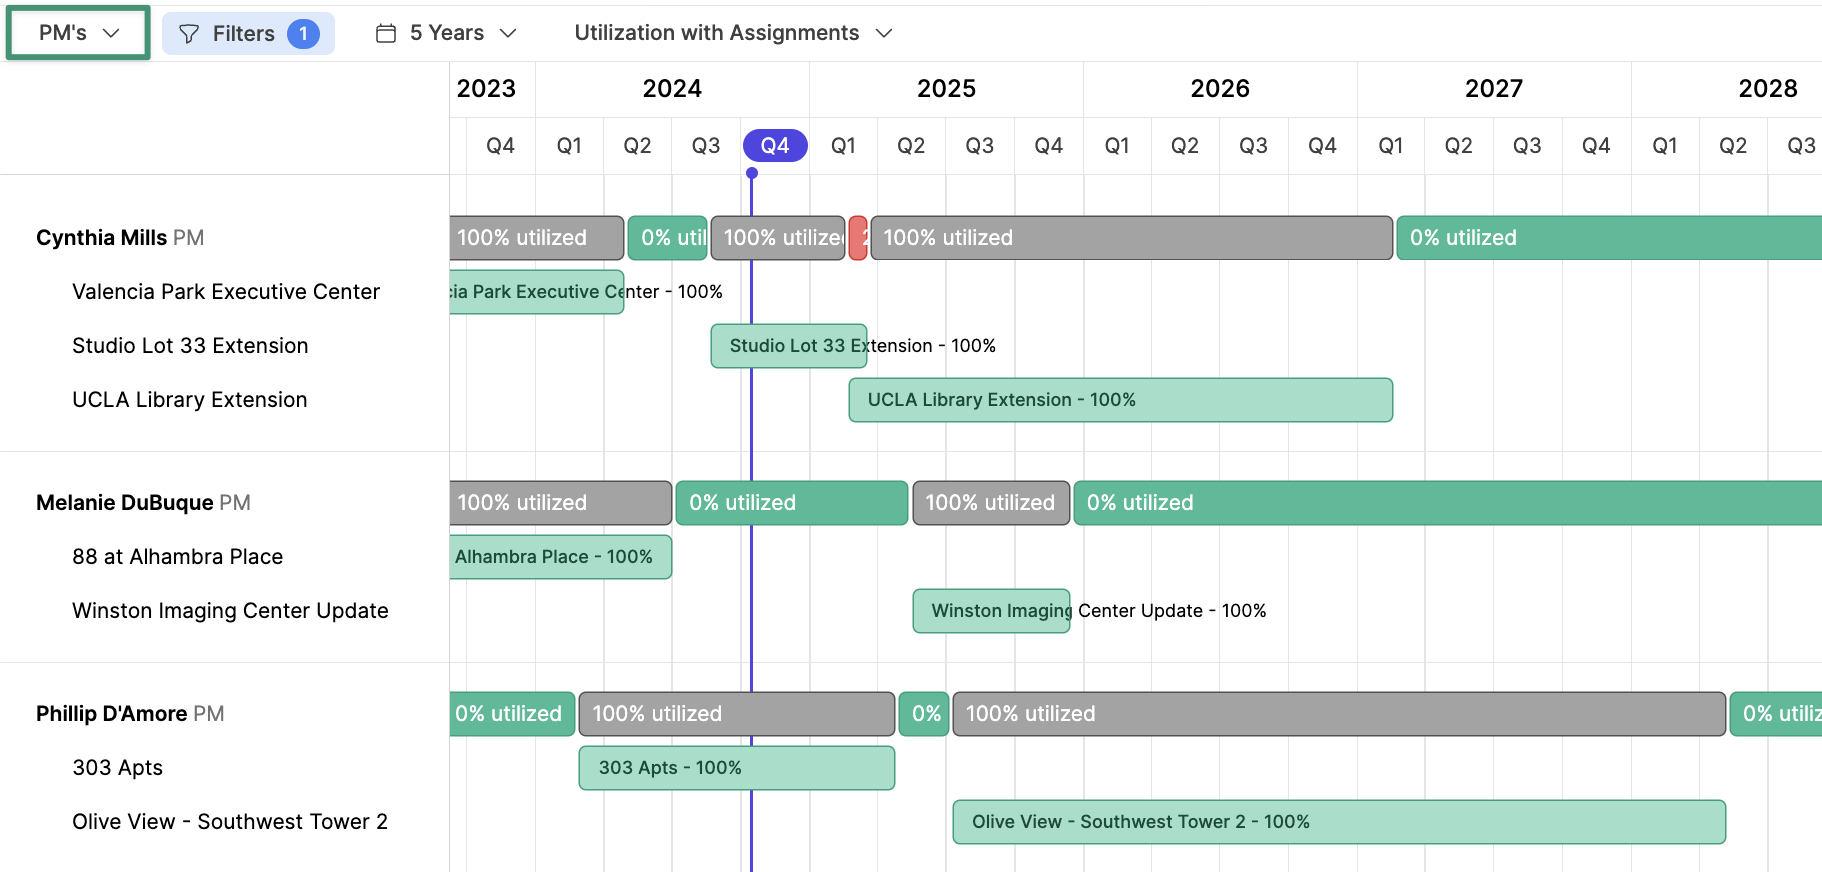
Tracking the utilization of each employee within your labor force is vital for optimizing workforce management. It helps identify underutilized employees, enabling efficient allocation of skills and labor to projects, increasing productivity, and reducing operational costs. Additionally, it provides insights into workload distribution, aiding in workload balancing, employee satisfaction, and overall workforce performance improvement. The Utilization Tab provides a line of sight into the utilization and availability of each employee in your Workforce.Role-Dependent Views
Track the utilization of all your Project Managers, Project Coordinators, Superintendents, etc.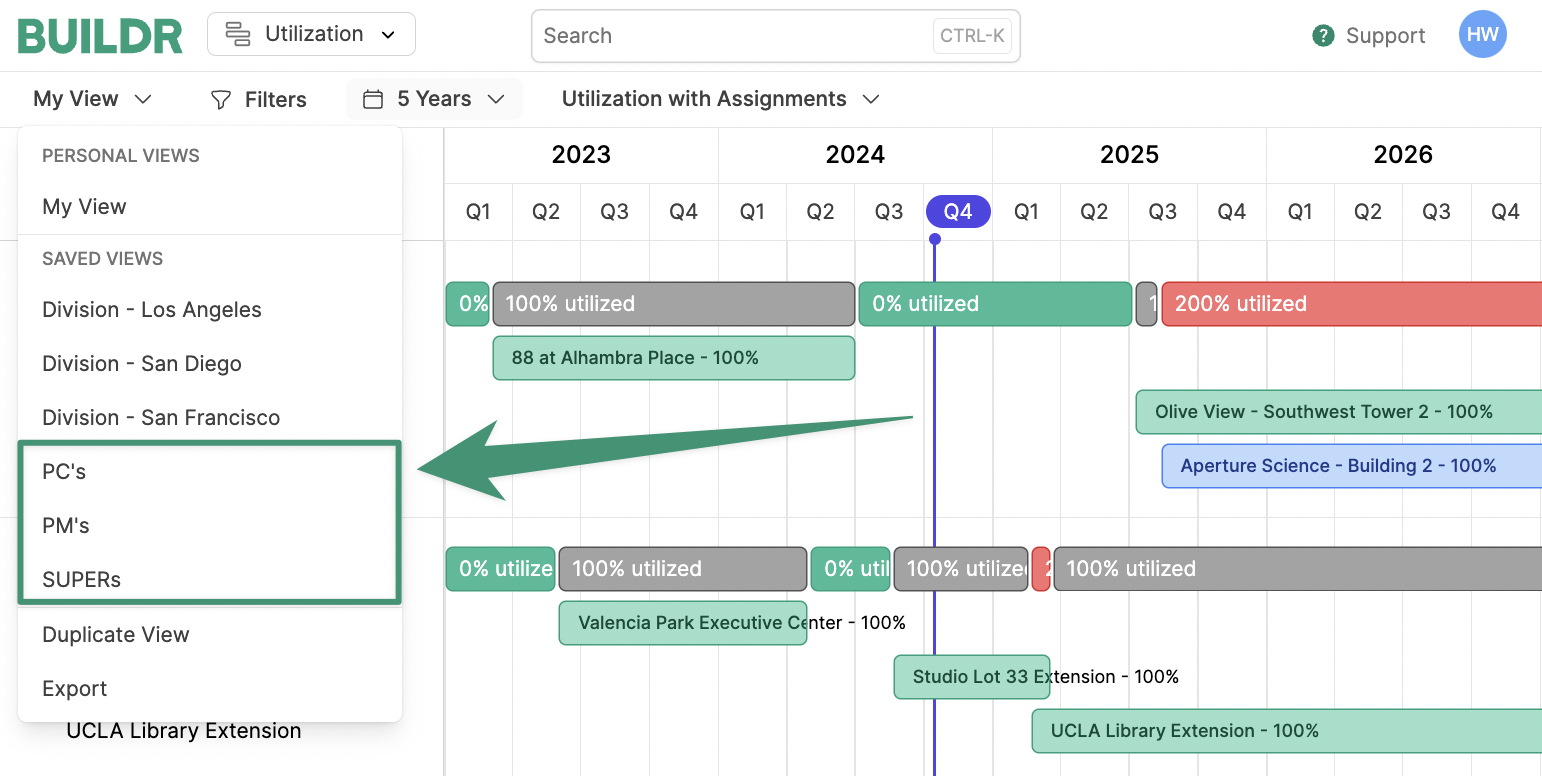
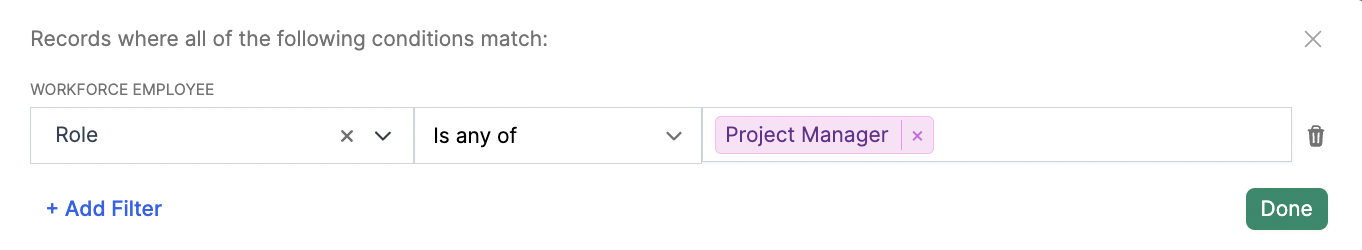
PM’s
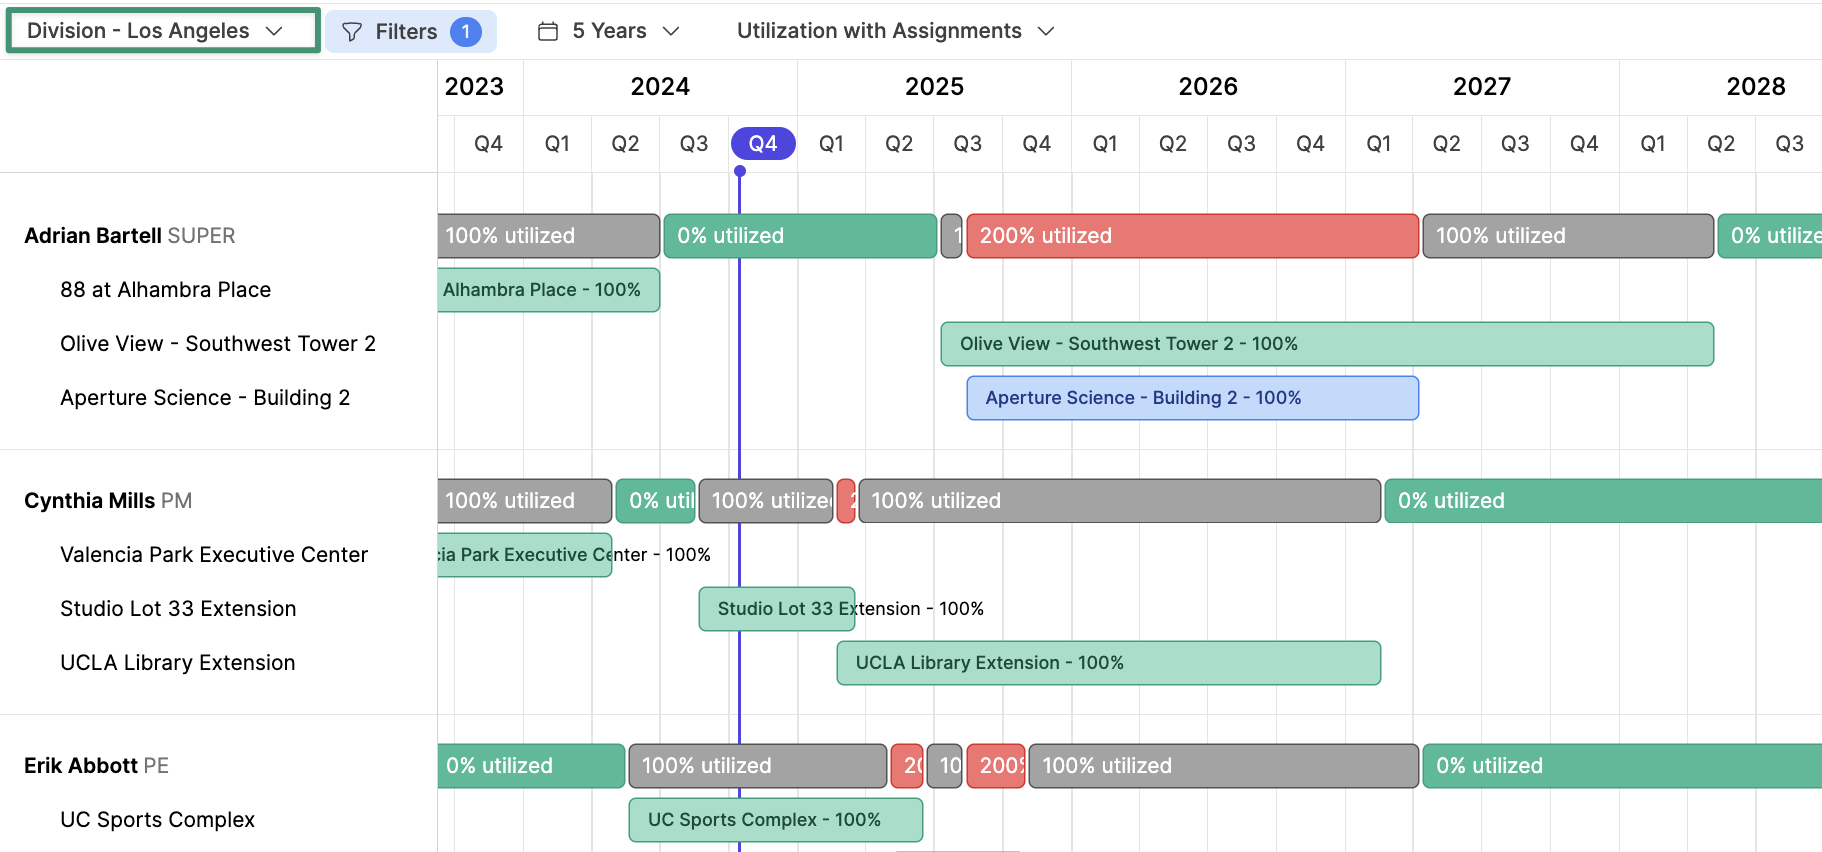
Division-dependent Views
Track the utilization and availability of each employee within a specific office or division.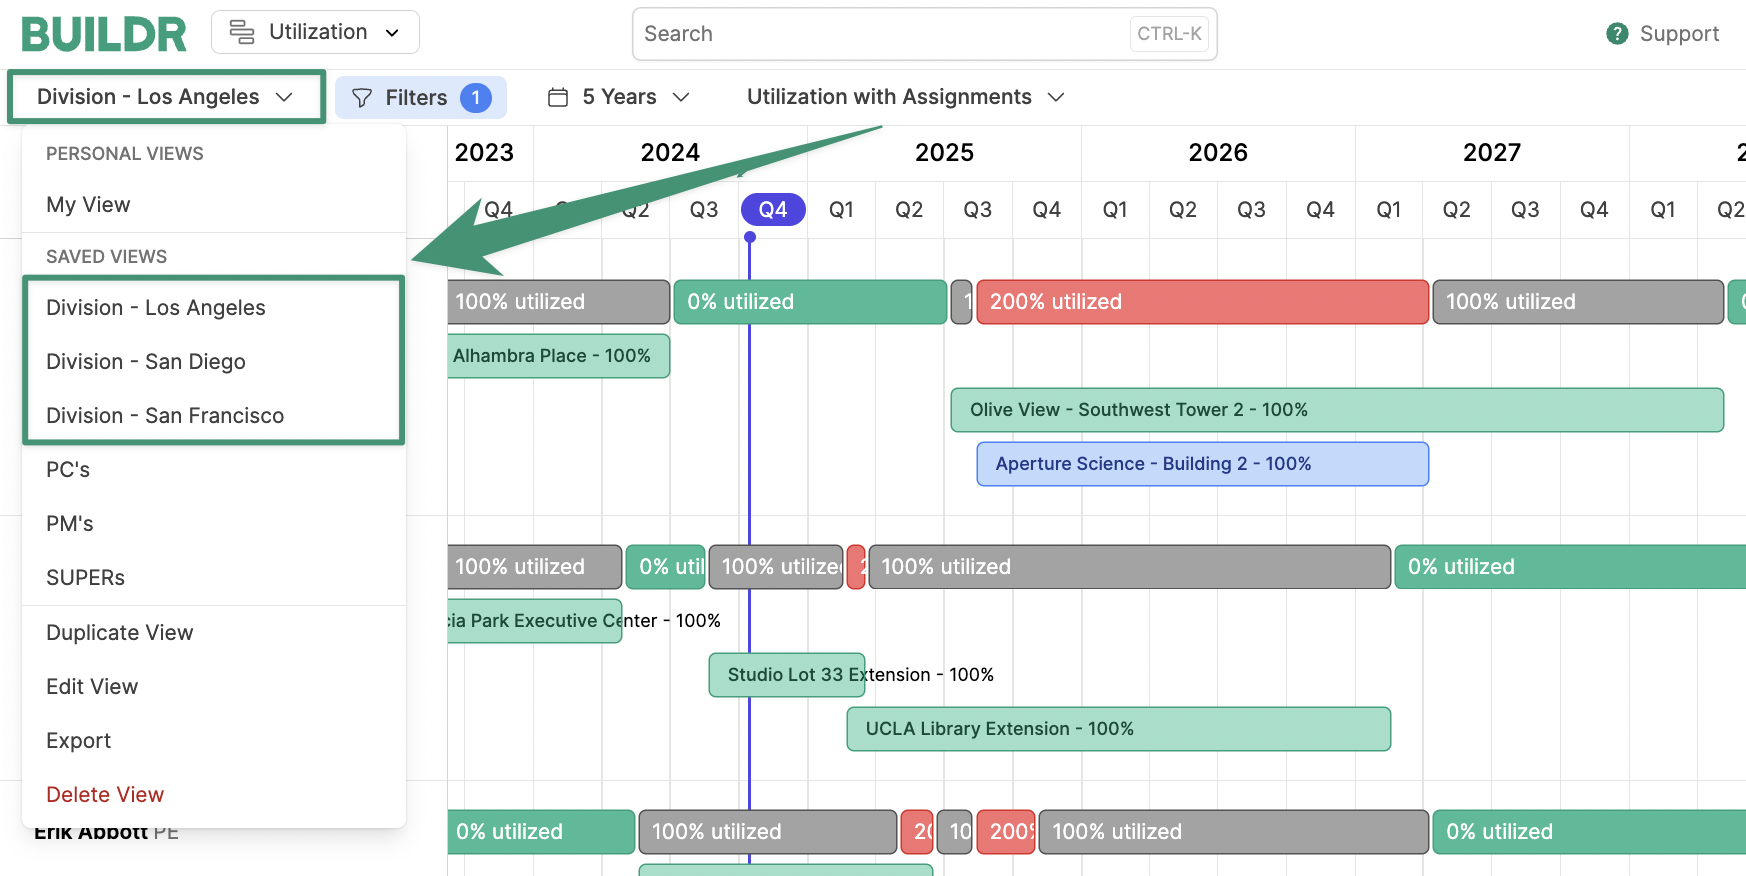
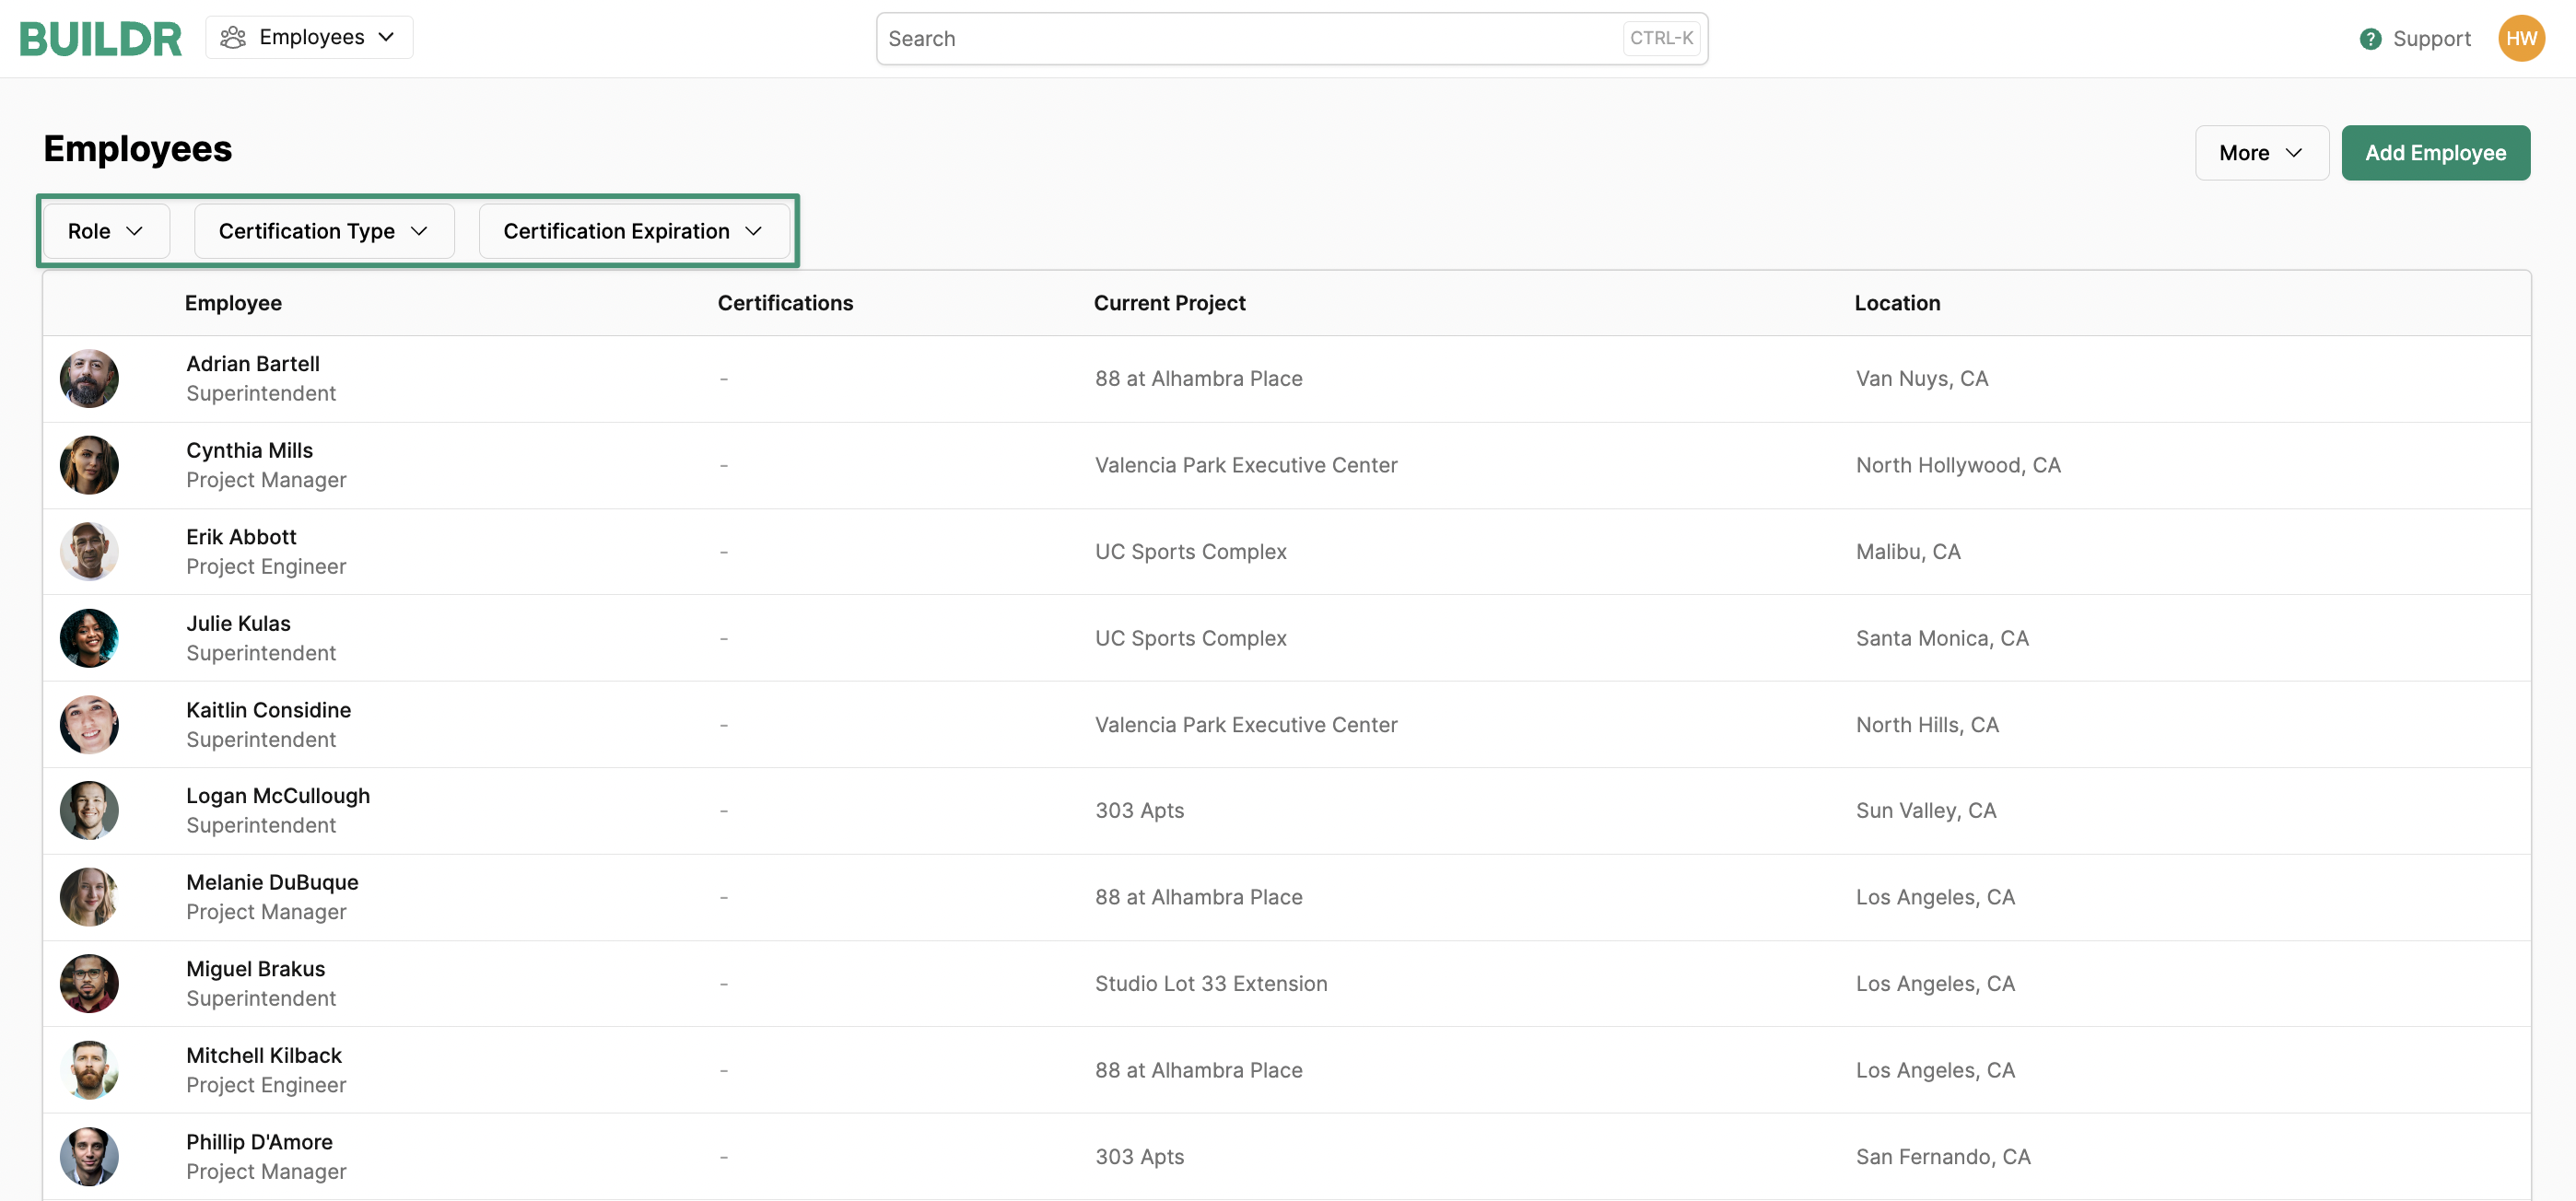
Employees
The Employees tab allows you to view and edit the details of your employees. This view shows the employee’s name, profile picture, job title, current project(s), and location by default. You can filter the list by an employee’s Role and Certification Type.