Utilization Chart
The utilization chart shows the total utilization of your workforce that are assigned to roles across all projects.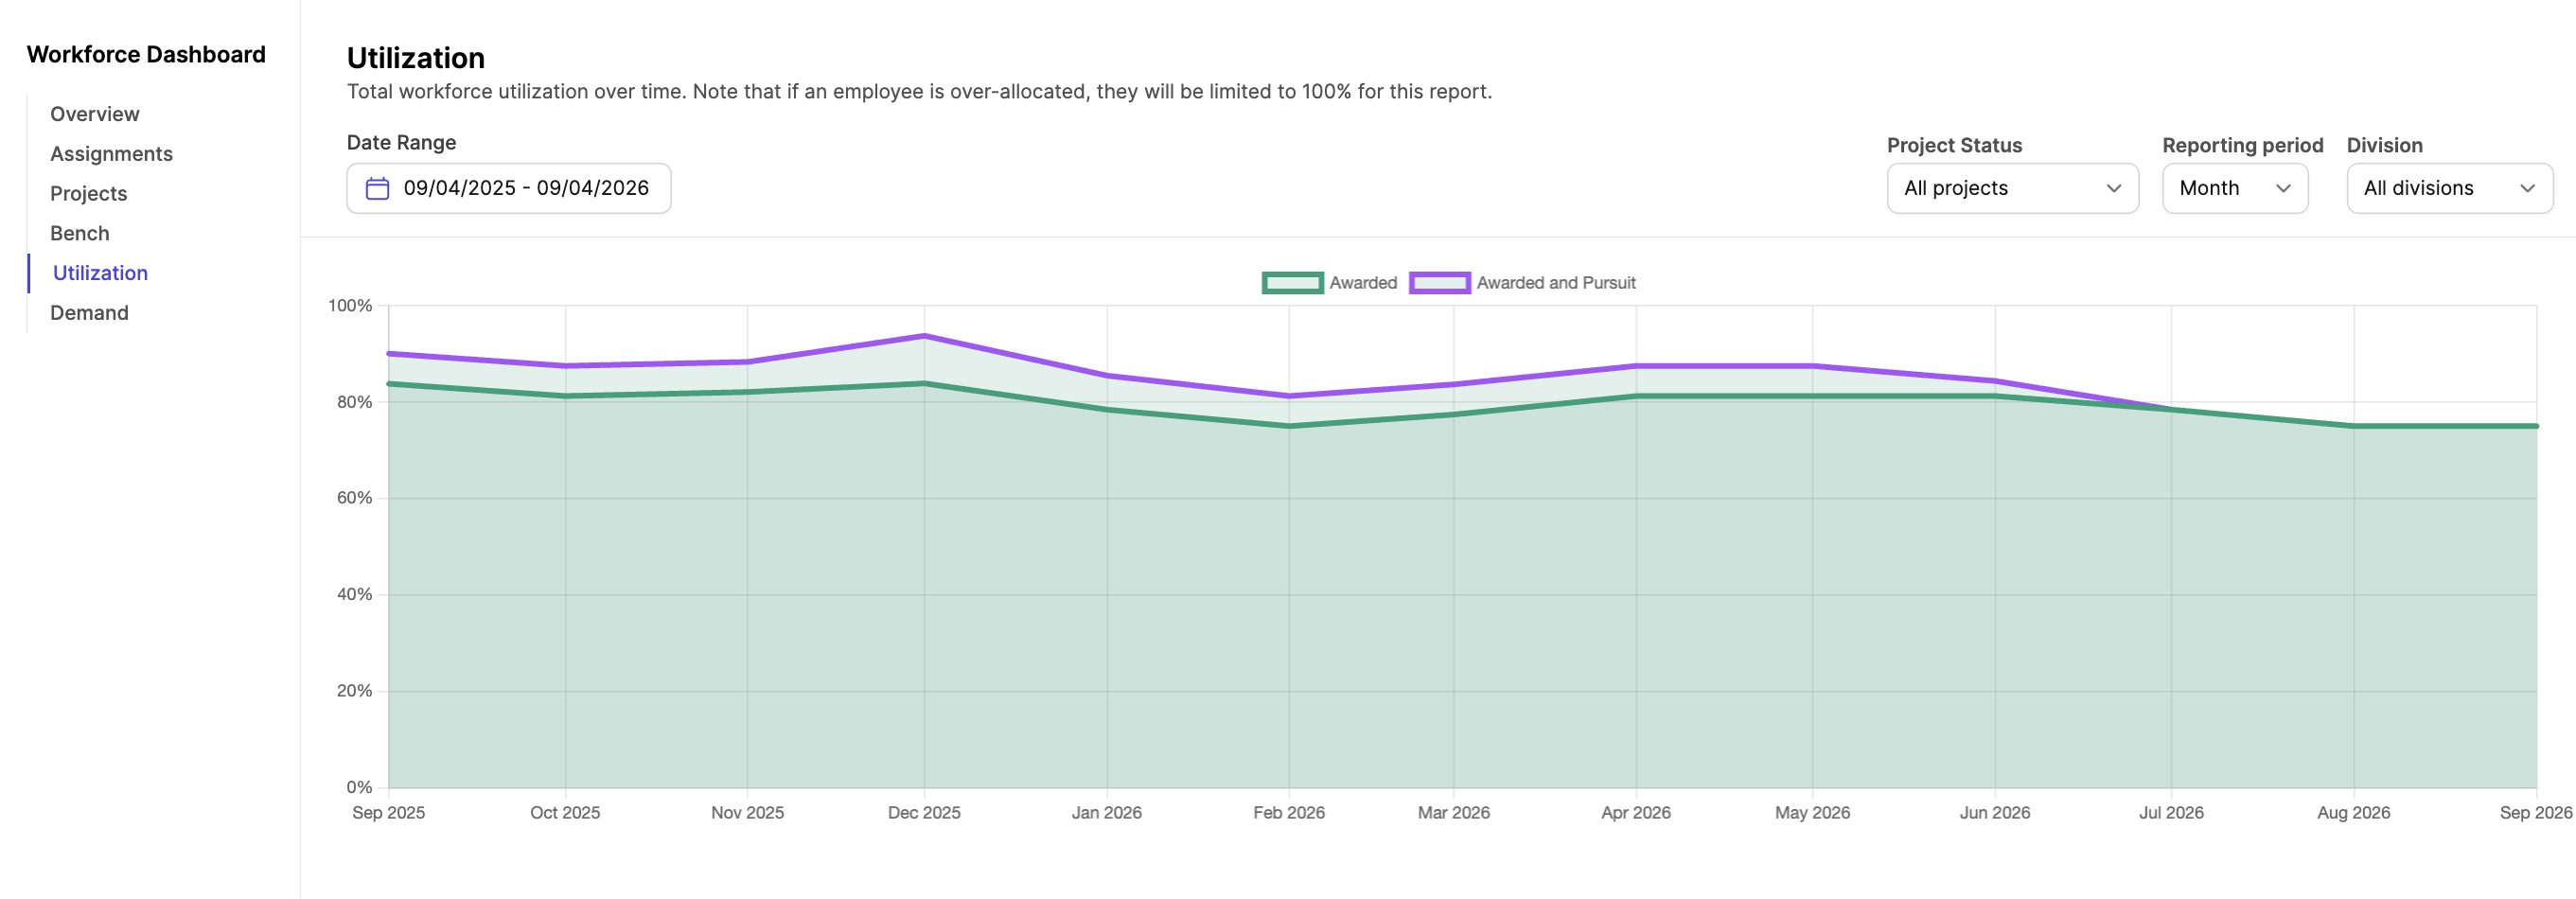
Demand Chart
The Demand chart is particularly useful because it shows you the number of employees you have compared to workforce demand due to awarded and pursuit projects.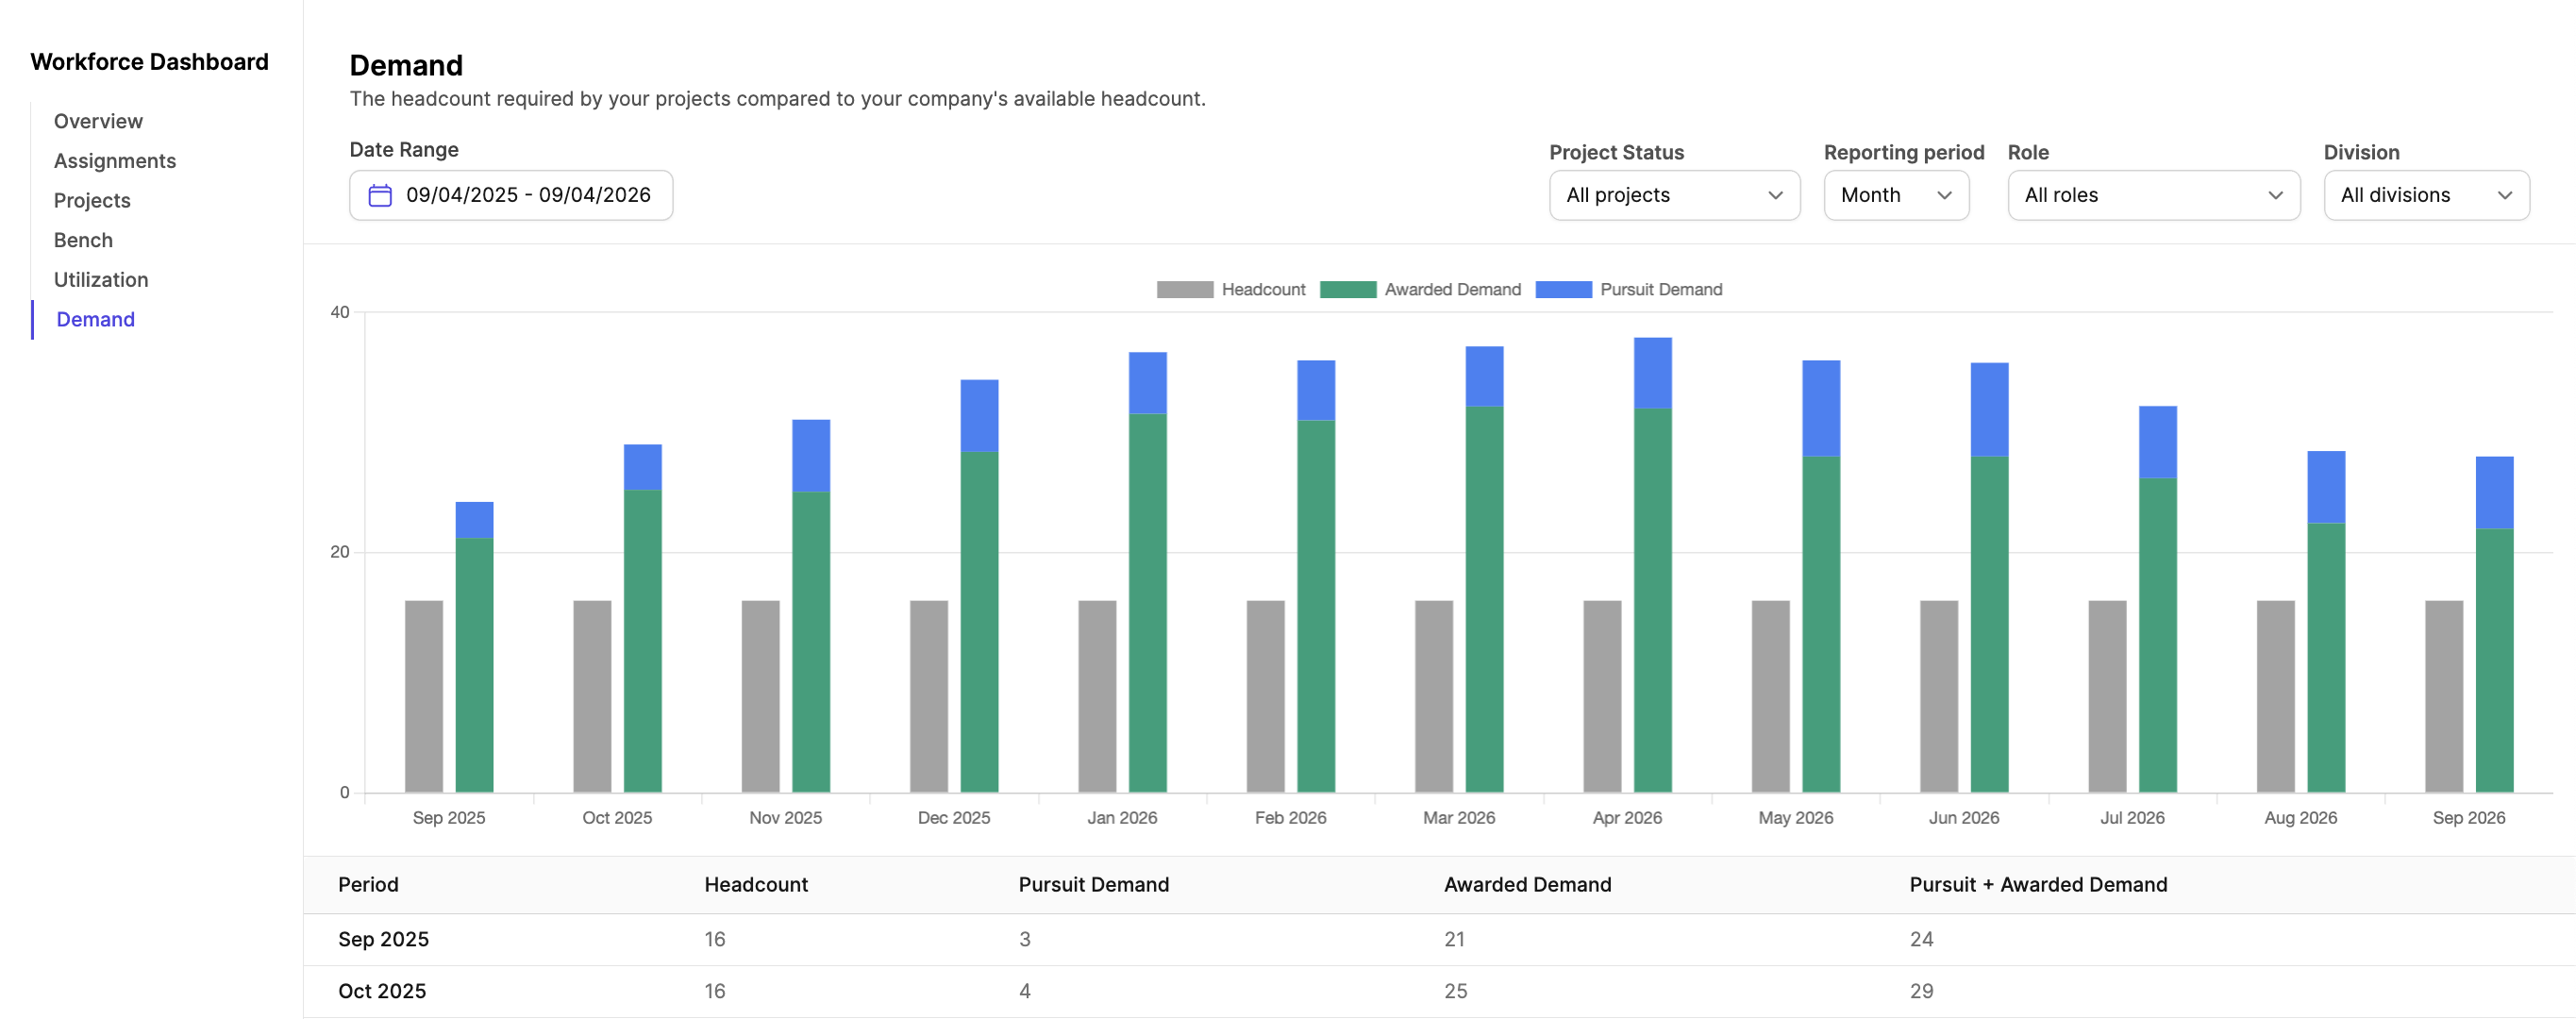
- The gray bar represents your actual number of employees.
- The green bar represents the number of employees necessary to fill the roles on awarded projects. The blue bar represents the number of employees necessary to fill the roles on pursuit stage projects.