Create a Report
To create a report, navigate to the Reports tab under Analytics.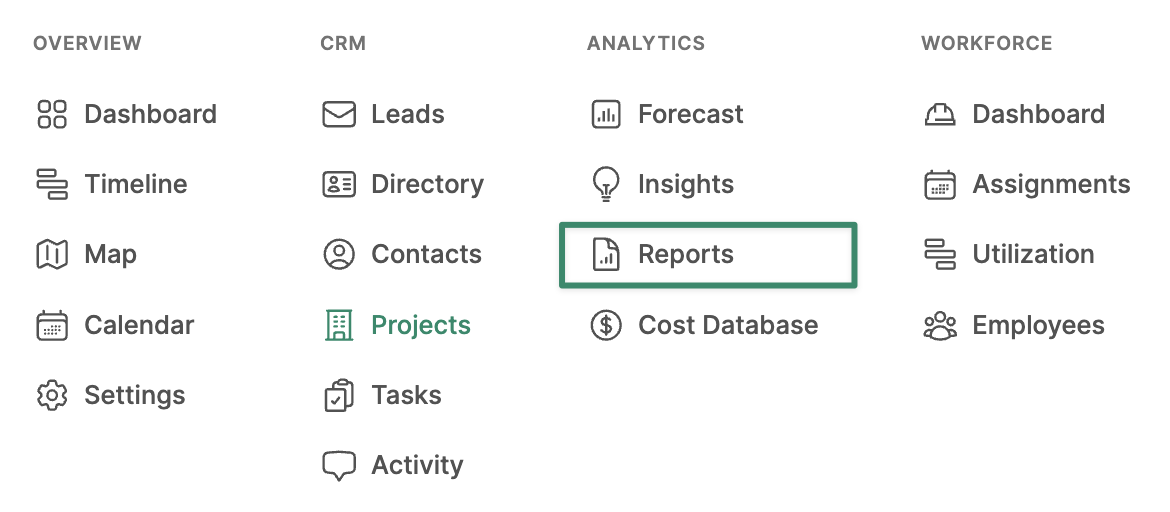
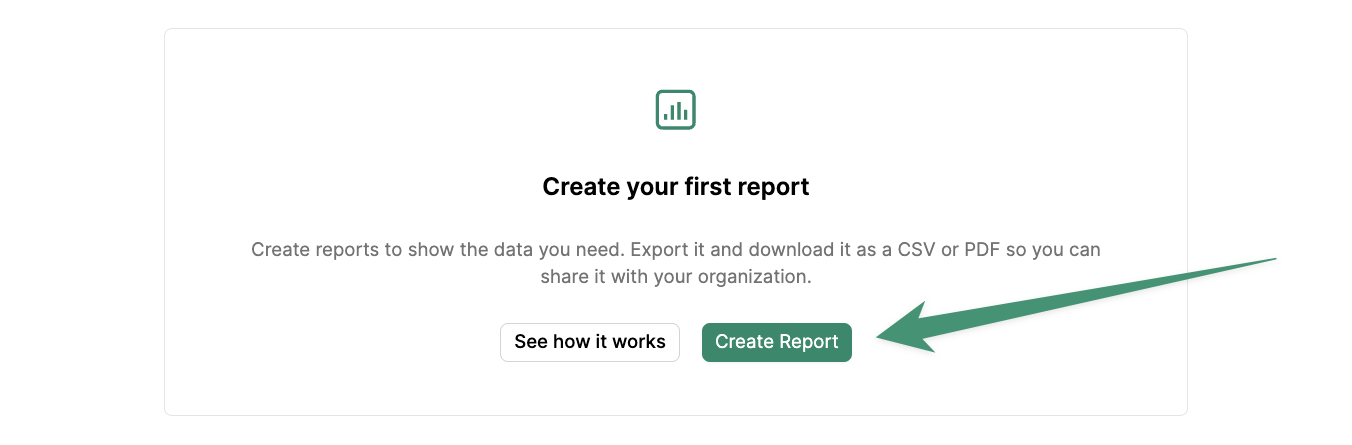
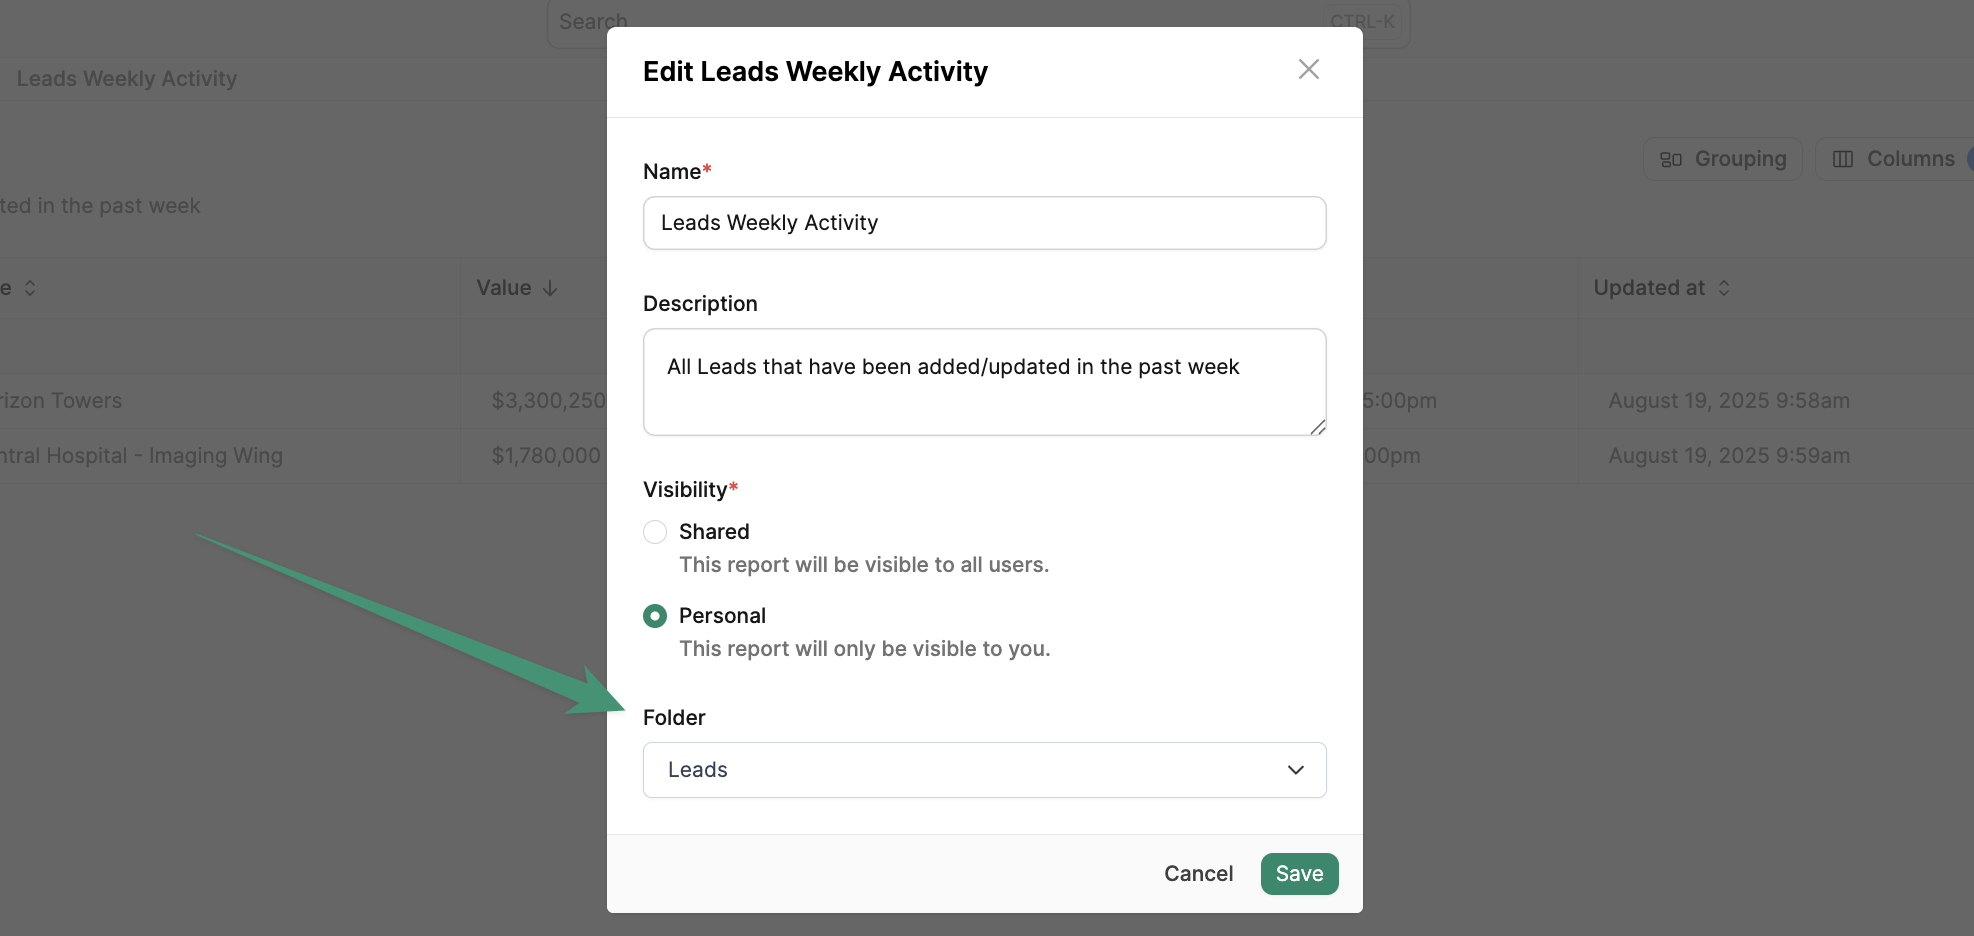
Create Report.
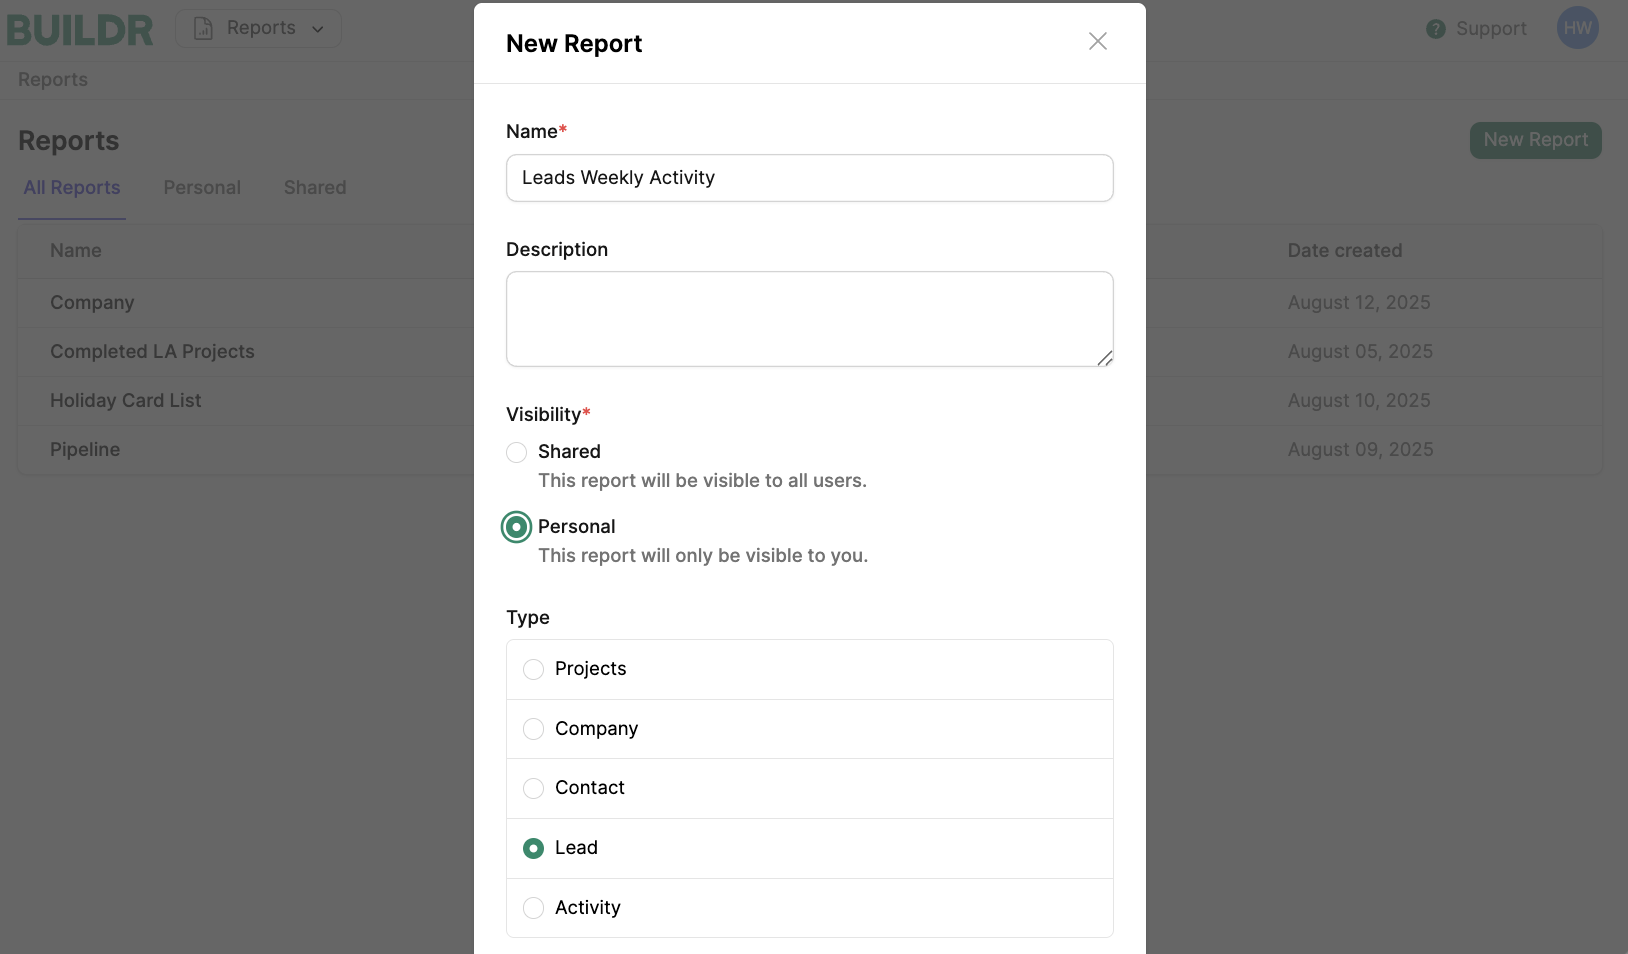
- Shared: This report will be visible to all users.
- Personal: This report will only be visible to you.
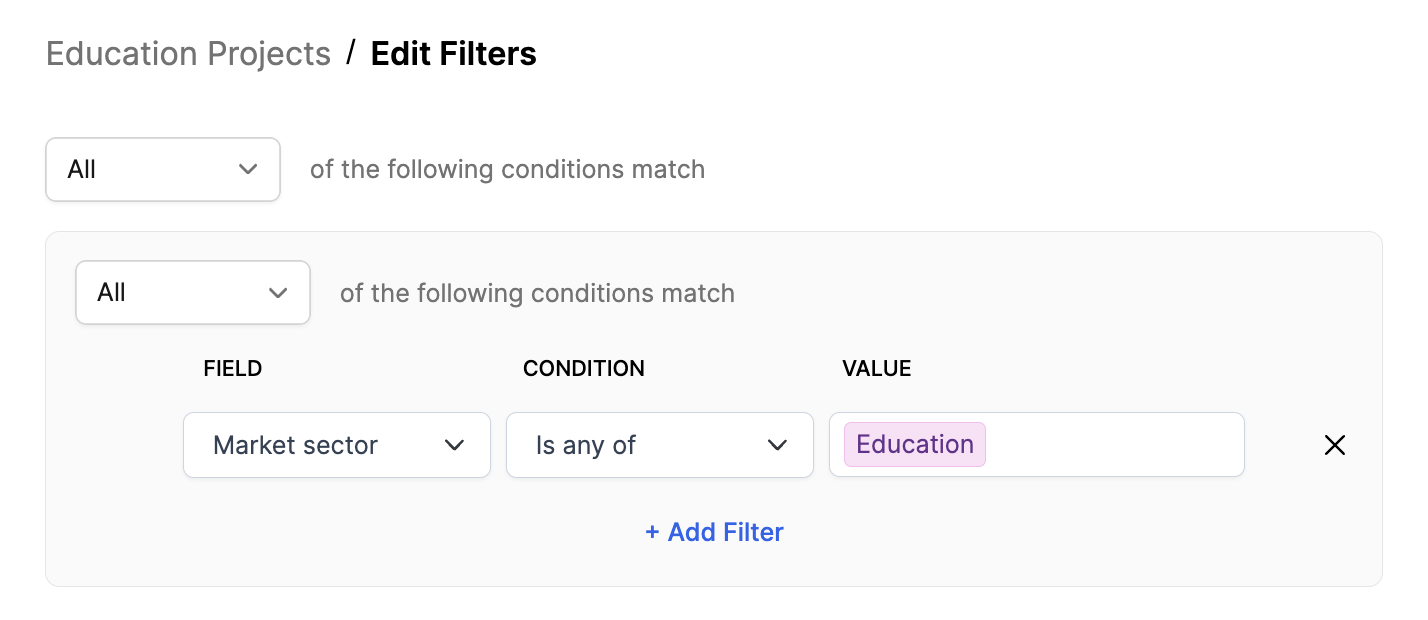
and/or conditions, and apply filter groups to view any set of data.
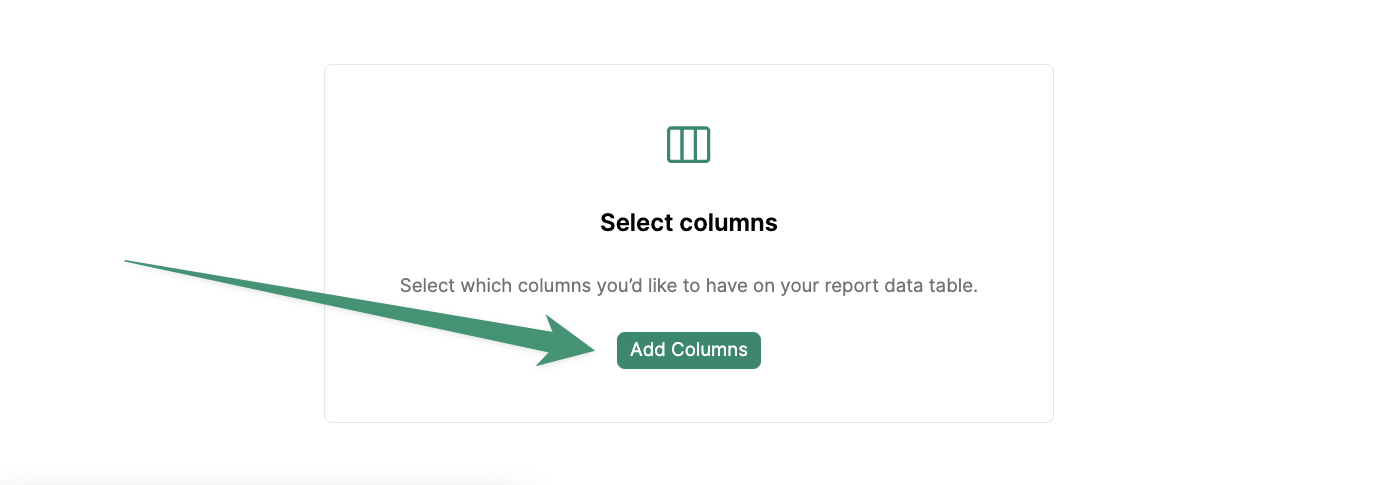
Save. Now, you can select the columns you wish to view in your report. Click Add Columns to get started.
Done.
Now, your report has been created and saved for future reference. Your team will be able to view all shared reports directly in the Reports tab.
Create Folders
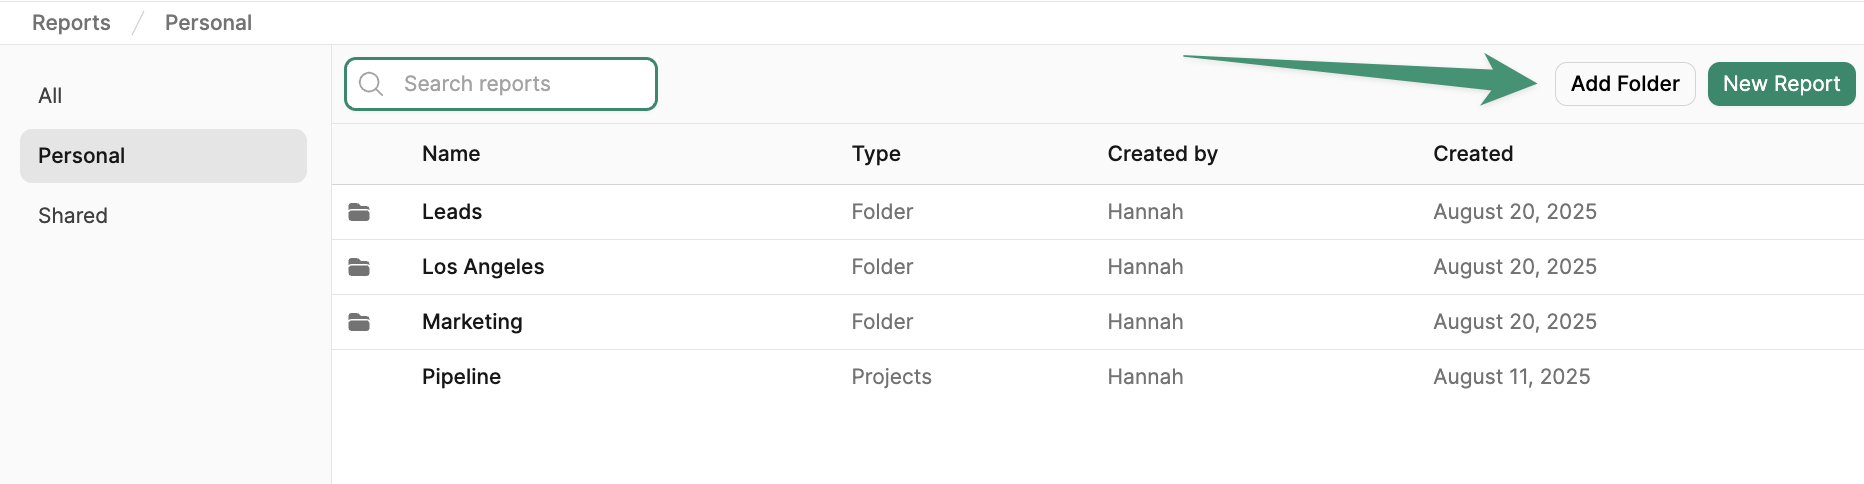
Reports can be organized into custom folders, either personal (visible only to you) or shared (visible to your entire team). To create a new folder, navigate to the Personal or Shared tab, and clickAdd Folder.
Aggregate Functions
Once your report is created, you can apply aggregate functions (sum, average, median, maximum, and minimum) to your columns. Simply hover over the top of the column in question, such as Contract Value, and clickChoose Summary. Next, select the desired summary from the list, and your column will be calculated accordingly.
Report Grouping
Report groups are a powerful tool for analyzing and calculating your data. Reports can be grouped by various parameters, such as Market Sector, Stage, Division, and more. In the example below, we are building a report of pipeline value by market sector. To group our pursuit projects by market sector, we clickGrouping, and select Market Sector.
Choose Summary, and selecting “Sum.” The report will display the total value of our pursuits by market sector.
Expand / Collapse All at the top of the page.
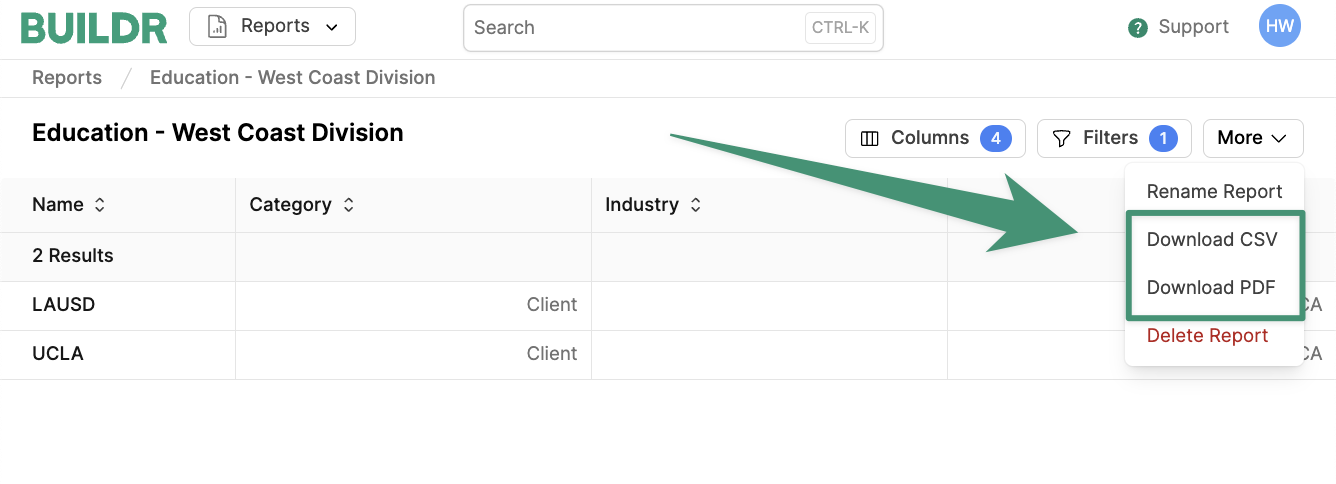
Export a Report
Reports can be exported to PDF or CSV. Click More and selectDownload CSV or Download PDF.
Report Admin permissions are required for exporting reports.
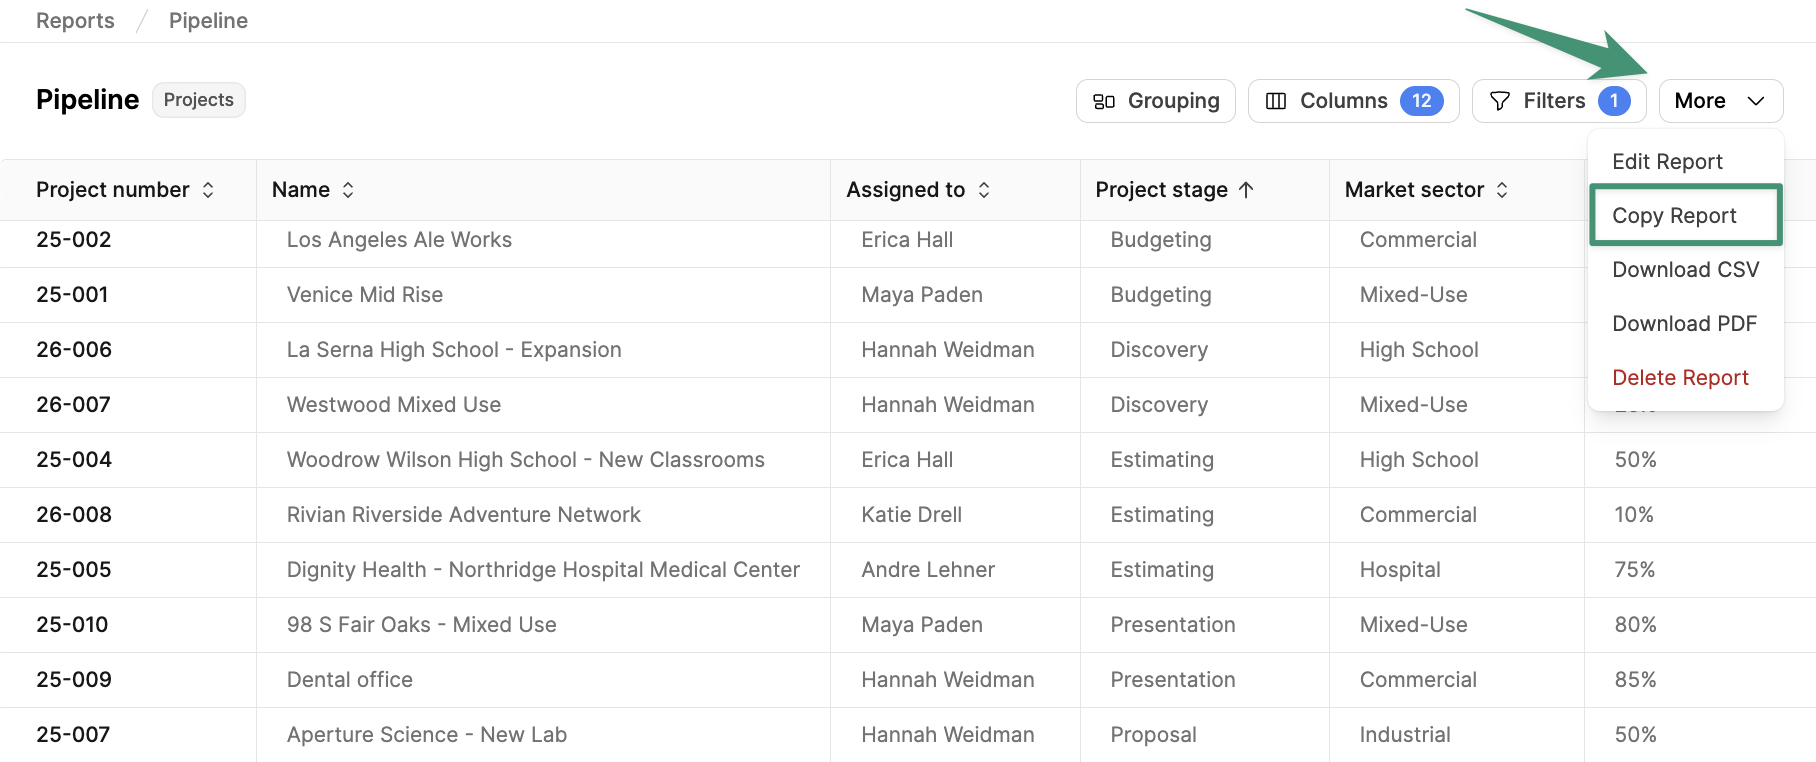
Copy a Report
To duplicate a report, click More and selectCopy Report.
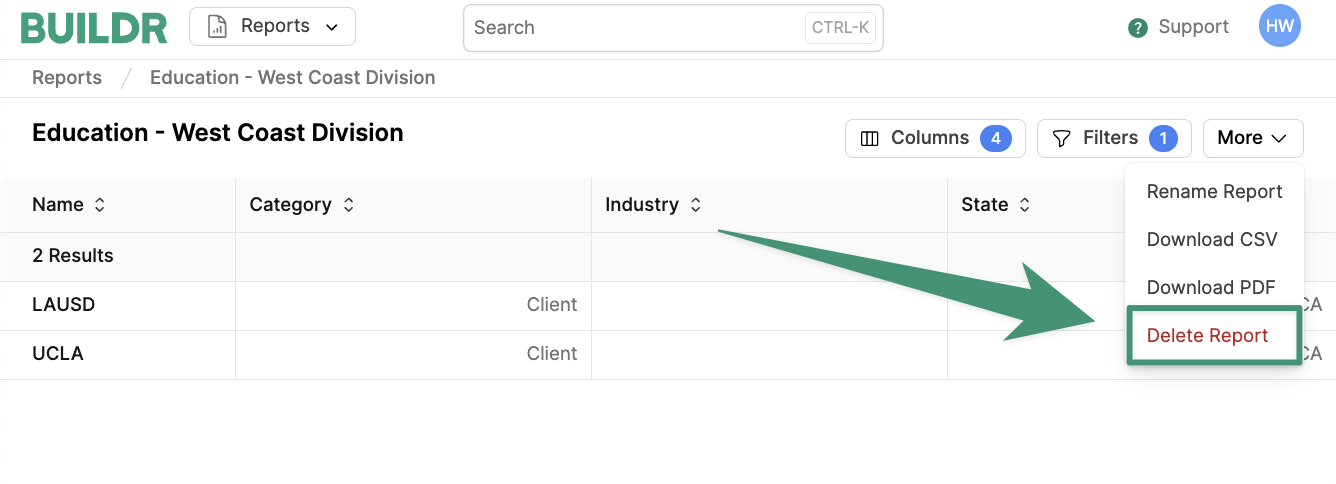
Delete a Report
To delete a report, click More and selectDelete Report.